
I'm often asked why I keep a 1-minute chart of the S&P 500 on my screen at all times. Since I don't trade on a short-term basis, it can be argued that the minute-to-minute movement of the market should be ignored. However, by watching the intraday action closely, the drivers of the market oftentimes become quite clear.
Such was the case yesterday afternoon as the President's announcement on Twitter that he was ending negotiations for further economic stimulus - stimulus that Fed Chairman Powell had practically begged for earlier in the day - sent stock prices into a freefall. Within 9 minutes of the tweet, the DJIA dove 548 points. And less than 20 minutes after the tweet, the Dow had fallen 625 points. Therefore, it was pretty clear that the market cares about additional economic stimulus - a lot.
Of course, the President's about-face on the topic of stimulus later in the evening appeared to cause the opposite effect as stock futures moved higher and the market has popped higher at the open, with the Dow rallying about 450 points as I type. So, from my perch, it is clear the primary driver of the market at this point in time is not the election, not earnings, not the outlook for inflation, but rather the state of additional stimulus.
My take is if a deal to put money in the hands of Americans who are suffering, airlines, restaurants, and small businesses can get done, then stocks can look ahead to better days. But if the stimulus becomes a political standoff, my guess is a test of the 200-day could be on the table.
Next, let's take a look at our Early Warning board for additional clues about the near-term action...
The State of the "Early Warning" Indicators
The Early Warning board is now in no-man's land. While I can argue that stocks are moving toward an overbought condition, sentiment is moving the other way, and the VIX indicators are neutral. One glance at the board below tells the whole story here as neither team has an edge. Thus, my take is that it's "game on" for control of the ball and the next meaningful move in the stock market.
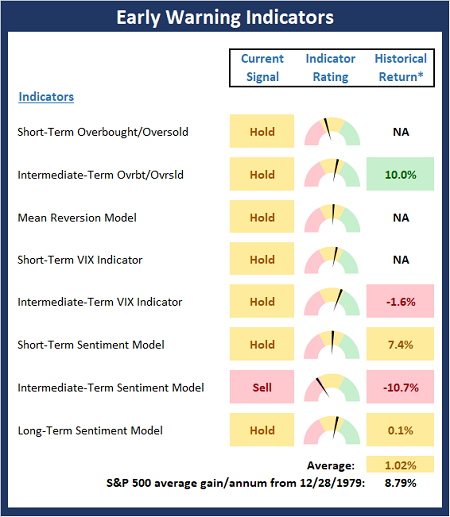
* Source: Ned Davis Research (NDR) as of the date of publication. Historical returns are hypothetical average annual performances calculated by NDR. Past performances do not guarantee future results or profitability - NOT INDIVIDUAL INVESTMENT ADVICE.
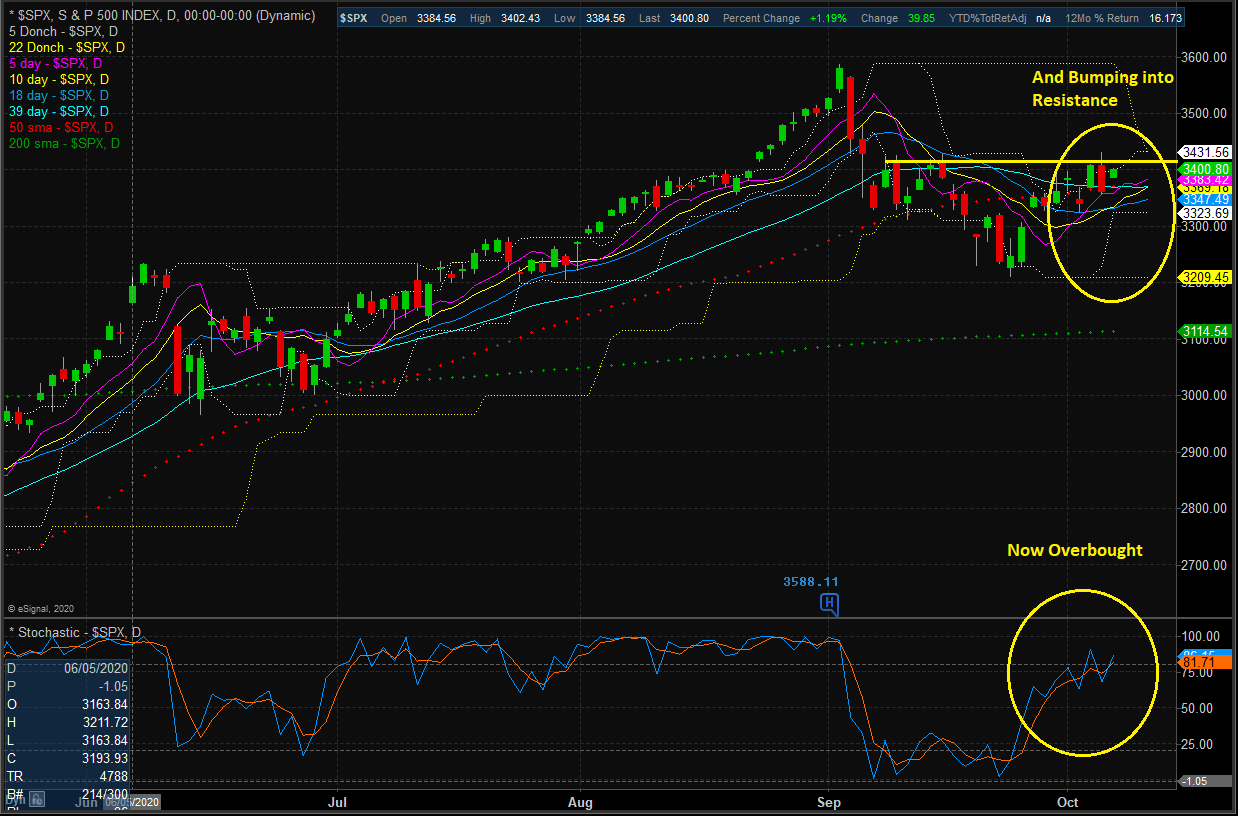
Stochastic Review
As you can see on the chart below, the stochastics are now in overbought territory. And with the S&P now bumping into overhead resistance, the argument can be made that it could be time for the bears to make a run. However, my feeling is that we're seeing a battle for control right at a critical technical juncture. As such, the near-term action once again takes on added importance. At the very least, we should expect volatility to stick around until the uncertainties over the stimulus and the prospects of a contested election are resolved.
S&P 500 - Daily
(Click on image to enlarge)


Comments
Log in or sign up to join the conversation.