
Alcoa Inc. (AA) is the world's leading producer and manager of primary aluminum, fabricated aluminum and alumina facilities, and is active in all major aspects of the industry. Alcoa serves the aerospace, automotive, packaging, building and construction, commercial transportation and industrial markets, bringing design, engineering, production and other capabilities of Alcoa's businesses to customers. In addition to aluminum products and components, Alcoa also markets consumer brands including Reynolds Wrap foils and plastic wraps, Alcoa wheels, and Baco household wraps. Among its other businesses are closures, fastening systems, precision castings, and electrical distribution systems for cars and trucks.
Alcoa is traditionally a big earnings report as it comes early in the "season." The firm is viewed as a harbinger for all the major companies reporting after, and right now the company is under a lot of scrutiny as it represents one of the commodities critical to the world economy--and is thus often viewed as a leading indicator.
Unfortunately, Alcoa's report after close today was not quite what analysts were looking for. The firm missed consensus estimates by a wide margin, posting earnings of $109 million--$ 0.07/share. Estimates were for $0.13/share. The company reasserted its view that global demand for aluminum will continue to climb, and is, in fact, ahead of projections, but that didn't help much for Q3 2015 results.
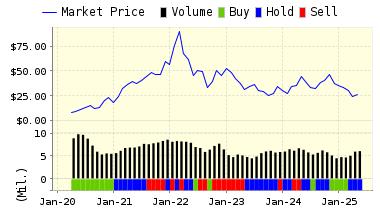
VALUENGINE RECOMMENDATION: We have had a hold on this firm since early August, and it will take a few days for our systems to update their calculations and calculate any change in rating. For now. ValuEngine continues its HOLD recommendation on ALCOA INC for 2015-10-07. Based on the information we have gathered and our resulting research, we feel that ALCOA INC has the probability to ROUGHLY MATCH average market performance for the next year. The company exhibits ATTRACTIVE Company Size but UNATTRACTIVE Earnings Growth Rate.
|
ValuEngine Forecast |
||
|
Target |
Expected |
|
|---|---|---|
|
1-Month |
10.93 | -0.11% |
|
3-Month |
11.21 | 2.44% |
|
6-Month |
11.80 | 7.90% |
|
1-Year |
10.79 | -1.35% |
|
2-Year |
12.97 | 18.59% |
|
3-Year |
16.93 | 54.73% |
|
Valuation & Rankings |
|||
|
Valuation |
15.30% overvalued |
Valuation Rank(?) |
|
|
1-M Forecast Return |
-0.11% |
1-M Forecast Return Rank |
|
|
12-M Return |
-31.41% |
Momentum Rank(?) |
|
|
Sharpe Ratio |
-0.16 |
Sharpe Ratio Rank(?) |
|
|
5-Y Avg Annual Return |
-4.52% |
5-Y Avg Annual Rtn Rank |
|
|
Volatility |
28.17% |
Volatility Rank(?) |
|
|
Expected EPS Growth |
-46.32% |
EPS Growth Rank(?) |
|
|
Market Cap (billions) |
13.31 |
Size Rank |
|
|
Trailing P/E Ratio |
11.52 |
Trailing P/E Rank(?) |
|
|
Forward P/E Ratio |
21.45 |
Forward P/E Ratio Rank |
|
|
PEG Ratio |
n/a |
PEG Ratio Rank |
|
|
Price/Sales |
0.55 |
Price/Sales Rank(?) |
|
|
Market/Book |
1.41 |
Market/Book Rank(?) |
|
|
Beta |
1.48 |
Beta Rank |
|
|
Alpha |
-0.47 |
Alpha Rank |
ValuEngine Market Overview
|
Summary of VE Stock Universe |
|
|
Stocks Undervalued |
58.88% |
|
Stocks Overvalued |
41.12% |
|
Stocks Undervalued by 20% |
23.5% |
|
Stocks Overvalued by 20% |
12.92% |
ValuEngine Sector Overview
|
Sector |
Change |
MTD |
YTD |
Valuation |
Last 12-MReturn |
P/E Ratio |
|
1.57% |
4.72% |
0.27% |
4.78% overvalued |
2.36% |
23.23 |
|
|
0.44% |
3.21% |
-3.38% |
1.85% overvalued |
1.20% |
24.31 |
|
|
1.10% |
2.94% |
0.01% |
0.02% undervalued |
-0.41% |
16.53 |
|
|
1.22% |
4.62% |
-9.17% |
1.26% undervalued |
-8.54% |
21.54 |
|
|
1.59% |
5.15% |
-6.04% |
1.88% undervalued |
-4.55% |
21.42 |
|
|
1.09% |
4.41% |
-2.42% |
2.13% undervalued |
-0.61% |
28.82 |
|
|
1.18% |
4.27% |
1.81% |
2.92% undervalued |
0.29% |
26.70 |
|
|
1.11% |
2.34% |
3.36% |
3.10% undervalued |
5.07% |
29.31 |
|
|
0.74% |
3.29% |
-6.76% |
3.90% undervalued |
0.96% |
22.62 |
|
|
0.60% |
3.51% |
-2.88% |
4.58% undervalued |
-4.29% |
17.55 |
|
|
2.07% |
15.41% |
-16.24% |
5.10% undervalued |
-42.99% |
26.17 |
|
|
1.40% |
5.98% |
-8.62% |
5.72% undervalued |
-10.68% |
18.10 |
|
|
1.84% |
5.03% |
-0.97% |
7.07% undervalued |
2.57% |
20.94 |
|
|
1.44% |
5.29% |
-12.49% |
8.67% undervalued |
-9.22% |
15.66 |
|
|
2.41% |
7.40% |
-4.30% |
9.80% undervalued |
-0.83% |
15.28 |
|
|
1.40% |
9.65% |
-14.82% |
12.38% undervalued |
-24.55% |
23.71 |
VALUATION WATCH: Overvalued stocks now make up 41.12% of our stocks assigned a valuation and 12.92% of those equities are calculated to be overvalued by 20% or more. Two sectors are calculated to be overvalued.
Comments
Log in or sign up to join the conversation.