
This week is proving to be a bad one for airline stocks as negative earnings forecasts and slowed expansion plans have seen investors dumping shares of major carriers. So far this week, we have seen most of the major US carriers provide guidance that predicts weaker demand, excess capacity, and lower profits for the rest of 2015.
Gary C. Kelly, Southwest (LUV) Chairman of the Board, President, and Chief Executive Officer, noted that despite "Solid traffic and revenue trends [in May] . . . and [strong growth in] markets under development . . . with weaker than expected economic growth, we continue to evaluate our 2016 capacity plans with a current intent to cap our [Available Seat Miles (ASM)] growth to approximately six percent, year-over-year."
American Airlines (AA) cut its forecast for Q2 unit revenue and pretax margins and forecast a decrease in revenue-per seat-mile of 6%-8%.
United Continental Holdings (UAL) noted this week that it also expects unit revenue for this quarter to decline--at a rate of 5%-6%
Delta Airlines (DAL) made similar statements to the media and President Ed Bastian noted that the company sees several routes where there is excess capacity present and noted that, like Southwest, the airline is re-evaluating expansion places for later in the year.
Airlines had been on a roll for the past few years, with hedging strategies--and then lower prices--for fuel, added fees for--and profits from-- everything from blankets and pillows to carry on bags, and better labor relations leading to good profits and filled aircraft. Even if passengers found that the new conditions destroyed much of the romance associated with flying, share holders were reaping the benefits.
But, now it appears as though many carriers may be in need of some new gimmicks and revenue sources. Fuel costs remain relatively low, but they are running out of new ways to boost the bottom line. Planes are often @80% full. Investors have noticed the situation, and a sell off has been underway since last month, when shares of Southwest, American, Delta, and United lost @ $10 billion as executives began to sound the alarm about the weakening outlook. Shares in the majors took a beating yesterday as well, with double-digit losses now the case across the board when compared to just one -month ago.
Below is our valuation data and some other metrics for the largest US carriers. As you can see, our models still find the companies relatively undervalued, but it will take some time for adjusted earnings estimates to make their way through our systems. Many of these companies remain ranked a "BUY" or "STRONG BUY" at the moment, as the system still ranks them as better investment targets that other stocks in our data base. They still have decent one-year forecast return estimates--for the most part.
|
Ticker |
Company Name |
Market Price |
Valuation |
Last 12-M Retrn |
Avg 5-Yr Retn (%) |
P/E Ratio |
|
AAL |
AMERICAN AIRLINES |
39.86 |
-9.85% |
-0.75% |
36.54% |
5.29 |
|
ALK |
ALASKA AIR GROUP |
62.53 |
-9.45% |
27.02% |
34.23% |
12.61 |
|
DAL |
DELTA AIR LINES |
40.75 |
-7.45% |
2.10% |
23.01% |
11.21 |
|
LUV |
SOUTHWEST AIRLINES |
36.11 |
-25.05% |
36.52% |
21.83% |
13.05 |
|
UAL |
UNITED CONTINENTAL HOLDINGS |
51.73 |
-17.83% |
16.59% |
20.07% |
6.03 |
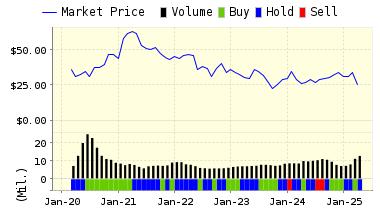
Below is today's data on LUV:
Southwest Airlines is a major domestic airline that provides primarily shorthaul, high-frequency, point-to-point, low-fare service. Southwest operates over Boeing 737 aircraft in numerous cities. Southwest has the lowest operating cost structure in the domestic airline industry and consistently offers the lowest and simplest fares. Southwest also has one of the best overall Customer Service records.
VALUENGINE RECOMMENDATION: ValuEngine continues its STRONG BUY recommendation on SOUTHWEST AIR for 2015-06-08. Based on the information we have gathered and our resulting research, we feel that SOUTHWEST AIR has the probability to OUTPERFORM average market performance for the next year. The company exhibits ATTRACTIVE Company Size and Momentum.
|
ValuEngine Forecast |
||
|
Target |
Expected |
|
|---|---|---|
|
1-Month |
36.59 |
1.33% |
|
3-Month |
36.00 |
-0.30% |
|
6-Month |
36.20 |
0.24% |
|
1-Year |
41.90 |
16.03% |
|
2-Year |
32.46 |
-10.10% |
|
3-Year |
22.57 |
-37.51% |
|
Valuation & Rankings |
|||
|
Valuation |
25.05% undervalued |
Valuation Rank |
|
|
1-M Forecast Return |
1.33% |
1-M Forecast Return Rank |
|
|
12-M Return |
36.52% |
Momentum Rank |
|
|
Sharpe Ratio |
0.80 |
Sharpe Ratio Rank |
|
|
5-Y Avg Annual Return |
21.83% |
5-Y Avg Annual Rtn Rank |
|
|
Volatility |
27.18% |
Volatility Rank |
|
|
Expected EPS Growth |
21.69% |
EPS Growth Rank |
|
|
Market Cap (billions) |
24.51 |
Size Rank |
|
|
Trailing P/E Ratio |
13.05 |
Trailing P/E Rank |
|
|
Forward P/E Ratio |
10.73 |
Forward P/E Ratio Rank |
|
|
PEG Ratio |
0.60 |
PEG Ratio Rank |
|
|
Price/Sales |
1.30 |
Price/Sales Rank |
|
|
Market/Book |
4.13 |
Market/Book Rank |
|
|
Beta |
0.92 |
Beta Rank |
|
|
Alpha |
0.25 |
Alpha Rank |
Overvalued stocks now make up 62.35% of our stocks assigned a valuation and 24.55% of those equities are calculated to be overvalued by 20% or more. ALL sectors are calculated to be overvalued--with eight at or near double digits.
Comments
Log in or sign up to join the conversation.