

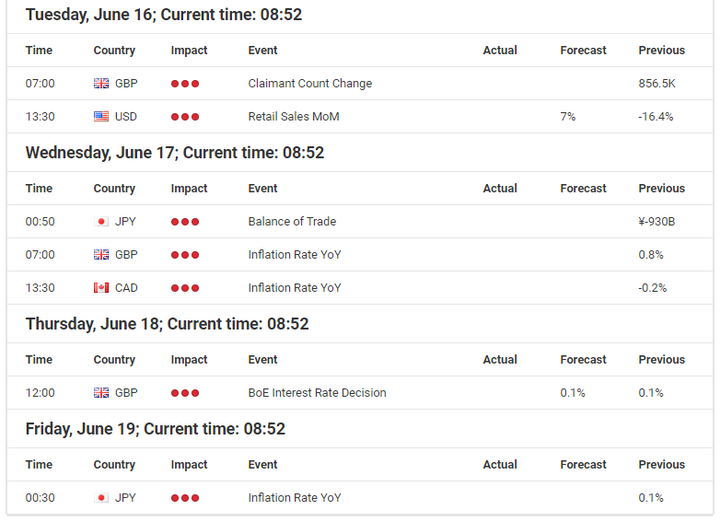
Source: Economic Events Calendar June 15 – 19, 2020 - Admiral Markets' Forex Calendar
DAX30 CFD
After the Fed rate decision on Wednesday, the DAX lost some of the momentum it has had since it took off mid-May, where it gained more than 25% from its lows in less than a month.
On Thursday, the tide turned and the German index dropped more than 5%, back below 12,000 points.
While the German index could close the week above 12,000 points, it became clear that, despite the 'Equity-friendly' rhetoric from the Fed on Wednesday which can fairly be interpreted as 'ultra-dovish' and showing a clear tendency towards flattening the 2-10-year-US-yield curve again which pushed to its widest difference since 2018 before last week's Fed meeting, market participants expect "more" from the US central bank, and that much of the Fed's dovishness was already priced into the market.
That said, there seems to be an elevated risk of another sharper drop in the days to come, initiated probably by a break in 10-year US Treasury yields below 0.60% and a EURUSD recapturing 1.1400 as a result, since a stronger Euro could, at least short-term, weigh on the DAX 30.
The technical main focus will be on the region around 11,800 points, a break lower makes a deeper correction possible and could see a re-test of the region around 11,450/500.
On the other hand: if bulls quickly regain control and avoid a drop below the pre-weekly lows, deeper correction, the German index could see a deeper run back above 12,000 points:
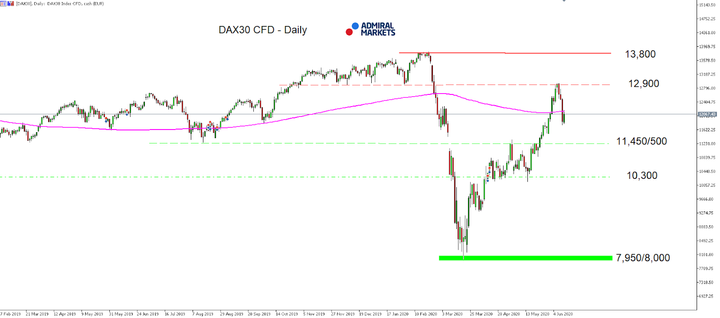
Source: Admiral Markets MT5 with MT5-SE Add-on DAX 30 CFD Daily chart (between February 27, 2019, to June 12, 2020). Accessed: June 12, 2020, at 10:00pm GMT - Please note: Past performance is not a reliable indicator of future results, or future performance.
In 2015, the value of the DAX 30 CFD increased by 9.56%, in 2016, it increased by 6.87%, in 2017, it increased by 12.51%, in 2018, it fell by 18.26%, in 2019, it increased by 26.44% meaning that after five years, it was up by 34.2%.
US Dollar
While at first glance it seems as if the picture in the US dollar hasn't significantly changed over the last week of trading, on a closer look, the picture clearly darkened.
While technically the mode stays neutral between 94.00 and 104.00 points, chances of a near-term (and probably even break) below 94.00 points seem elevated.
While 10-year US yields saw a push back towards the region around 1.00% after a surprisingly strong NFP report on the 05th of June, the days after market participants started to realize that the report was very likely a 'fake' report with the BLS stating that […]there was also a large number of workers who were classified as employed but absent from work.[…] and that […]if the workers who were recorded as employed but absent from work due to "other reasons" (…), the overall unemployment rate would have been about 3 percentage points higher than reported[…]
And after the Fed last week on Wednesday reinforced her dovish stance, the Fed dot plot suggesting that she will keep interest rates at 0% at least till the end of 2022 and continue to buy USTs and MBS at least at the current pace, thus showing her willingness of flattening the 2-10-year-US-yield curve again, developments in 10-year US Treasury yields will be in our focus in the days to come.
If we get a sustainable drop below 0.60% here, likely pushing the Euro (FXE) (which has a weight of 58% in the basket in the USD Index Future) against the USD above 1.1400, a drop below 94.00 with further bearish momentum in the Greenback (UUP) also against the GBP (FXB) and JPY (FXY), should be expected:
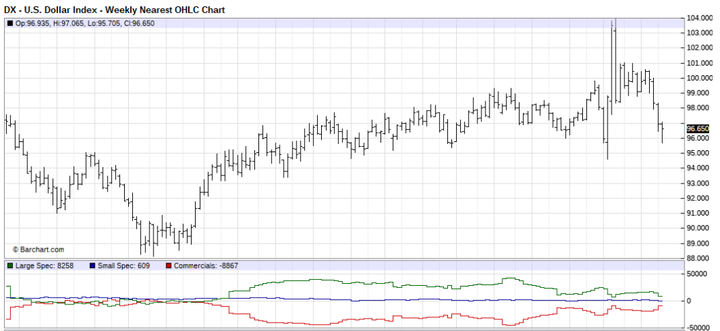
Source: Barchart - U.S Dollar Index - Weekly Nearest OHLC Chart (between July 2017 to June 2020). Accessed: June 12, 2020, at 10:00pm GMT
Euro
The Euro continued with its bullish performance over the last week of trading, especially against the US dollar, with the EUR/USD currently focusing on the region around 1.1400/50 USD on the upside.
One clear driver here is certainly the combination of the EU commission's proposal of a 750 Billion-Euro fiscal stimulus package with 500 billion Euro in grants and 250 billion in loans and the ECB's boost of its PEPP program at her last meeting to 1.35 trillion Euros and with being set to run through at least the end of June 2021.
This step towards a EU transfer union which led to a further reduction of the US-EU-yield differential can certainly result in a further rise in the EUR/USD in the days to come after the Fed came out fairly dovish last Wednesday again, pointing to a further increase of her already ballooned balance sheet over the last 2.5 months.
Nevertheless, EUR/USD traders should get a little careful due to the technical extended mode which reduces the short-term risk-reward-ratio to a more unattractive level.
In this context it is probably noteworthy that recent EZ economic indications kept on painting a very dark picture for the EZ economy (e.g. the final estimate of the Eurozone GDP for Q1 came in at -3.6% (QoQ)), leaving the option for a heavy deflationary shock in the EU on the table and thus leaves us expecting further ECB monetary stimulus in the months to come.
But, while this might be a topic in the second half of the year, especially if a next 'Corona-wave' hits society, short-term corrective moves down to 1.1150/1200, a little lower towards 1.1000 should be bought and we expect EURUSD to continue its bullish mode with targets around 1.1700/1.1800:
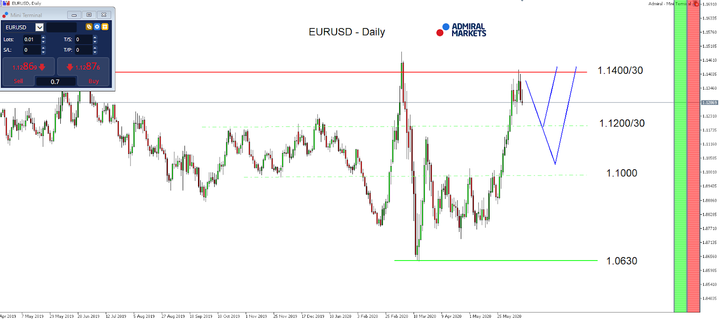
Source: Admiral Markets MT5 with MT5-SE Add-on EUR/USD Daily chart (between April 15, 2019, to June 12, 2020). Accessed: June 12, 2020, at 10:00pm GMT - Please note: Past performance is not a reliable indicator of future results, or future performance.
In 2015, the value of the EUR/USD fell by 10.2%, in 2016, it fell by 3.2%, in 2017, it increased by 13.92%, 2018, it fell by 4.4%, 2019, it fell by 2.2%, meaning that after five years, it was down by 7.3%.
JPY
In our last weekly market outlook we wrote
[…]JPY surprised with weakness over the last week of trading, the USD/JPY took on bullish momentum (…)
In fact, no real news was available which could have acted as a driver for the bearish JPY performance, making it difficult to consider the move to be sustainable.[…]
And indeed: until the Fed rate decision on Wednesday, the USD/JPY had not only given back most of its pre-weekly gains, but dropped even further, attacking the region around 106.80/107.00:.
One main driver was the accelerating drop in US yields, most likely due to the realization among market participants that the NFP report was more 'fake' than real and the BLS stating that […]there was also a large number of workers who were classified as employed but absent from work.[…] and that […]if the workers who were recorded as employed but absent from work due to "other reasons" (…), the overall unemployment rate would have been about 3 percentage points higher than reported[…]
And after the Fed last week on Wednesday reinforced her dovish stance, we see our sceptical view for the USD/JPY still supported, even though technically the currency pair can be considered neutral/choppy as long as the USD/JPY can hold above 106.80/107.00.
But, if we get to see a break lower, a test of the region around 105.00 and even a push lower seems a realistic option in the days and weeks to come and stays true as long as the currency pair does not sustainably recapture 109.00/50:
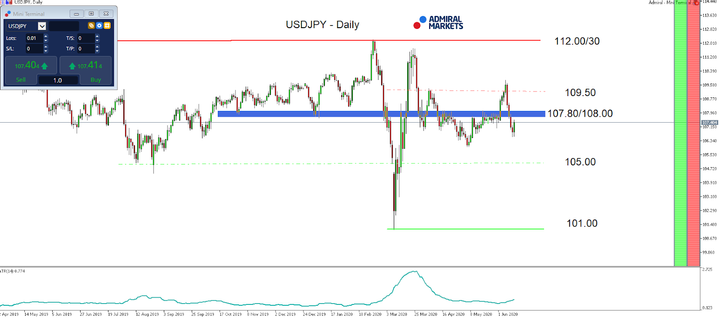
Source: Admiral Markets MT5 with MT5-SE Add-on USD/JPY Daily chart (between April 22, 2019, to June 12, 2020). Accessed: June 12, 2020, at 10:00pm GMT
In 2015, the value of the USD/JPY increased by 0.5%, in 2016, it fell by 2.8%, in 2017, it fell by 3.6%, in 2018, it fell by 2.7%, in 2019, it fell by 0.85%, meaning that after five years, it was down by 9.2%.
Gold
The picture for Gold (GLD) brightened again over the last week of trading. While the yellow metal dropped below 1,700 USD and went for an attack of the region around 1,660 USD after surprisingly 'strong' data from the US labour market, Gold recaptured 1,700 USD fairly quickly again last week, keeping the mid-term bullish outlook above 1,660 USD
Main reason seems to be that market participants realized more and more that the NFP report was very likely a 'fake' report with the BLS stating that […]there was also a large number of workers who were classified as employed but absent from work.[…] and that […]if the workers who were recorded as employed but absent from work due to "other reasons" (…), the overall unemployment rate would have been about 3 percentage points higher than reported[…]
And after the Fed last week on Wednesday reinforced her dovish stance the Fed dot plot suggesting that she will keep interest rates at 0% at least till the end of 2022 and continue to buy USTs and MBS at least at the current pace, thus showing her willingness of flattening the 2-10-year-US-yield curve again, the bearish divergence in the RSI(14) on a daily time-frame loses more and more its significance and making in our opinion a rather sooner than later stint to the all-time high around 1,920 USD likely.
In this context, Gold traders should keep a close eye on the developments in 10-year US Treasury yields where a sustainable drop below 0.60% seems only a question of time:
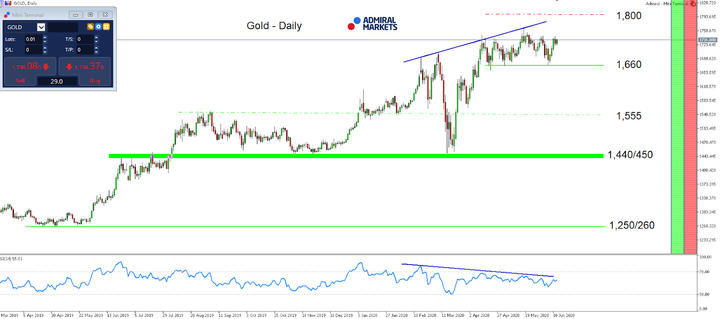
Source: Admiral Markets MT5 with MT5-SE Add-on Gold Daily chart (between March 14, 2019, to June 12, 2020). Accessed: June 12, 2020, at 10:00pm GMT - Please note: Past performance is not a reliable indicator of future results, or future performance.
In 2015, the value of Gold fell by 10.4%, in 2016, it increased by 8.1%, in 2017, it increased by 13.1%, in 2018, it fell by 1.6%, in 2019, it increased by 18.9%, meaning that after five years, it was up by 28%.



Comments
Log in or sign up to join the conversation.