


History back to 1820 gives hints regarding what may follow
With the recent closure of the Strait of Hormuz, many expect oil prices to spike and stay high. Instead, they have barely budged. The latest spike in prices is a mini spike. If these oil prices were adjusted for inflation, the spikes in the past would appear even higher.
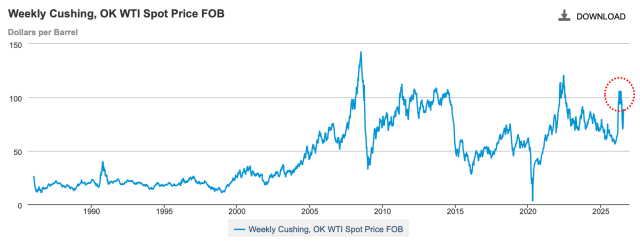
Figure 1. Weekly average oil prices for West Texas Intermediate oil in a chart provided by EIA, with Iran conflict price spike circled.
This is not a new problem. Looking at energy data going back to 1820, low demand (affordability) has repeatedly produced financial crashes, wars, and collapses. We appear to be entering another such period.
In this post, I examine differences in how the economy behaves, comparing two different types of periods: those with low energy affordability (“low demand”) and those with high energy affordably (“high demand”). I also offer my view on what this analysis suggests may be ahead for the world economy.
[1] How high demand differs from low demand
High demand looks like a situation in which, each year, an increasing number of people can afford cars and the fuel that they require. With high demand, the number of new cars sold each year tends to rise. Young people are eager to buy homes because they find homes affordable. They find their incomes relatively higher than their parents’ were at their age. Countries around the world find it easy to industrialize. This allows their citizens to have better lifestyles. As we will see later in this post, the periods of the 1950s, 1960s, and 1970s were periods of high growth in demand for oil products.
What we have now is the opposite: too many young people who cannot find jobs that pay well, even with advanced degrees. They cannot afford to go on a vacation or buy a new car. Record numbers live with their parents after they finish their schooling. They spend their spare time playing video games, rather than socializing with their friends.
The number of cars sold worldwide hit a peak in 2017, indicating indirectly that people are getting poorer. If people are not buying as many cars, demand for oil tends to fall, especially if more of the cars that are sold are electric.
Building new homes also takes oil. According to the US Census Bureau, the number of US new homes sold in the US hit a record of 1,283,000 in 2005. In 2025, the number of US new homes sold amounted to only 678,000, or about 53% of the peak amount. The huge drop in new home construction is a sign that people, quite often young people, are not as well off financially as they were years ago. They cannot afford to buy a new (or even a used) home anymore.
One study based on income tax data revealed that between 1948 and 1970, US incomes tended to rise faster than inflation. Between 1968 and 1983, the incomes of both the top 10% and the lower 90% rose as fast as inflation. However, between 1983 and 2012, the top 10% received far greater increases than the bottom 90% (Figure 2).
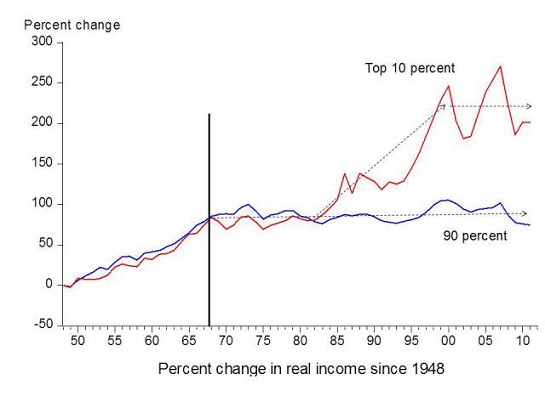
Figure 2. Chart comparing income gains by the top 10% to income gains by the bottom 90% by economist Emmanuel Saez. Based on an analysis of IRS data, published in Forbes.
If workers in the bottom 90% of the distribution are not doing well, it is difficult to keep prices of commodities as high as those producing the commodities would prefer. Purchases of commodities, including food, and fuel for vehicles, do not rise proportionately with huge incomes. Elon Musk and other very high-income individuals do not spend all day eating or driving their vehicles. The bottom 90% must prosper for demand (affordability) of oil and other commodities to stay high.
[2] What experience with high and low growth in energy supplies since 1820 teaches us.
Several years ago, I prepared an analysis of how the world economy behaved over the long term, over the period from 1820 to 2017. I have recently updated this study. I found that the economy behaved quite well in times of high energy consumption growth. In times of low energy consumption growth, there seemed to be many adverse events, such as financial crashes, wars, and government collapses.
I am afraid that with today’s oil and debt problems, we are headed into a pattern of low energy consumption growth, or even energy consumption contraction. If this is the case, we should expect outcomes at least as undesirable those experienced during past periods of low energy consumption growth in the past.
(a) Methodology
I first prepared a new data set by combining two data sets, the earlier of which was available only every 10 years, with more recent data available more frequently. The energy quantities reported were rising rapidly. To analyze how fast they were rising, I first computed the average annual increase percentage for each 10-year period, as shown on Figure 3.
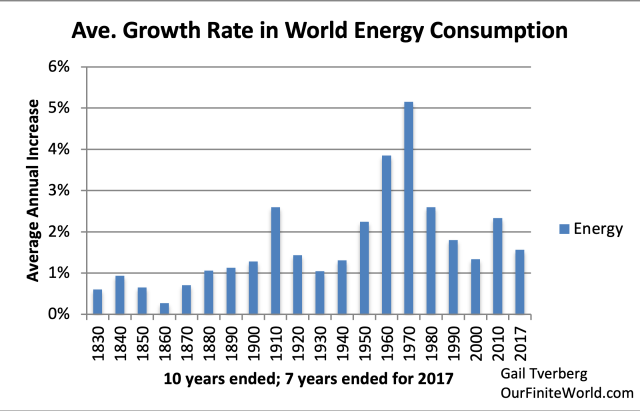
Figure 3. Average annual growth rate in world total energy consumption, for 10-year periods, except the latest period which is only 7 years. Energy growth estimates are based on data from Energy Transitions: History, Requirements and Prospects (Appendix) by Vaclav Smil for older years, and data from BP’s Statistical Review of World Energy for 1965 and subsequent. From this presentation.
For example, the period from 1961 to 1970 (shown as the 1970 bar) had a very high annual rate of growth rate for energy consumption. This was the period when many of the interstate highways in the US were opened and many pipelines were added.
On Figure 4, I divided the bars shown on Figure 3 into two parts.
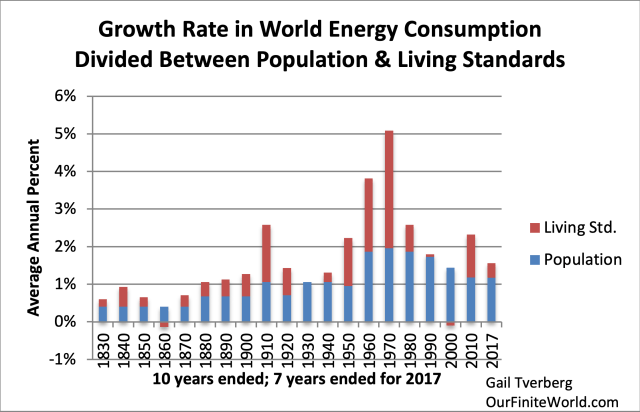
Figure 4. The blue bars on this chart represent the average annual increase in population, over the period indicated. The red bars represent the amount of the growth in energy consumption left over for growth in standards of living. Energy data is the same as in Figure 3. Population estimates for 1940 and prior are by Angus Maddison; estimates for more recent years are based on UN data.
On Figure 5, the blue portions of the bars represent the average annual increase in population over the 10-year period. The red portion of the bar is computed by subtraction from the total. It is the amount that seems to be left over for a rising standard of living. Having a tall red portion of the bar would be very good; having little or no red bar left would represent a problem. Note that in two periods (the one ended 1860 and the one ended 2000), the amount left over for an increase in living standards was negative.
(b) Good things happened in years with very high growth in “Living Standards”
Figure 5 shows the information on Figure 4 as an area chart.
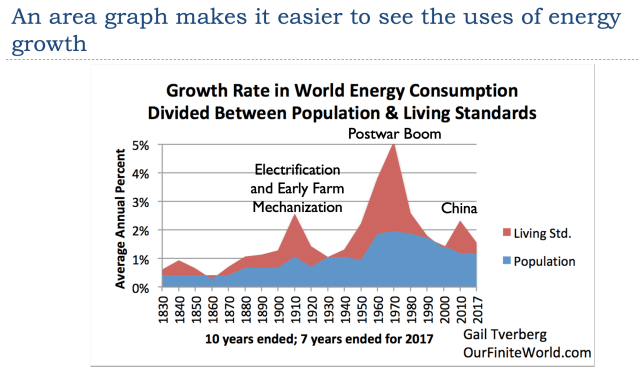
Figure 5. Chart from a 2018 presentation using the same energy data as Figures 4 and 5, with some of the related events marked.
While I don’t show oil prices on Figure 5, those who are familiar with oil prices will remember that high oil prices were a feature of the 1973 to 1981 period. Also, as China began its growth period, another spike in oil prices took place. High growth in energy supplies and high oil prices seem to go together. High demand from a growing economy tends to hold prices up.
The label “China” refers to the rapid growth that took place in the decade after China joined the World Trade Organization in 2001. This was mostly powered by China’s huge growth in coal supply between 2002 and 2011 (Figure 6).
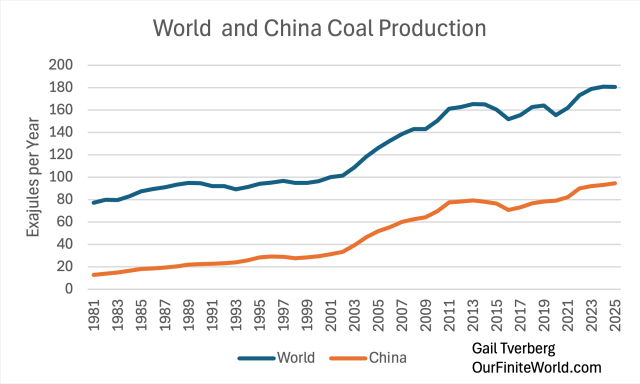
Figure 6. Production of coal for the World and for China based on data of the 2025 Statistical Review of World Energy, published by the Energy Institute.
China and the world experienced another spurt of increased coal production starting in 2022, when coal prices temporarily spiked to a high level, perhaps indirectly related to the conflict in Ukraine. But coal prices have gradually come back down, resulting in flat world growth in coal production since 2023, and a plateau in China’s coal production growth.
(c) Troubled Periods took place when the growth in “Living Standards” was low or negative
Figure 7 labels three periods with very severe dips in “Living Standards.”
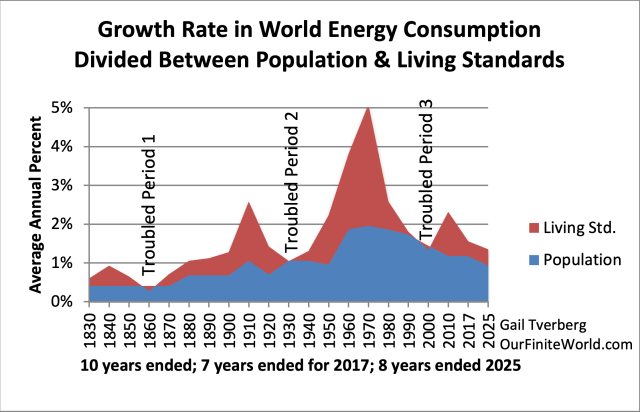
Figure 7. This figure is similar to Figure 5, with three “Troubled Periods” labeled. There is also a small section added, extending the analysis to cover the period to 2025.
The First Troubled Period started with the Panic of 1857, which some consider to be a cause of the US Civil War. According to this view, the collapse was related to an over-expansion of the US economy, followed by the collapse of the debt bubble that had allowed this expansion to occur. Financial problems affected both the North and the South.
As I see the situation, one part of this financial problem was the declining profitability of slave labor. In the US South, the labor of slaves was the main source of energy used to operate plantations. An underlying issue was that the soil had gradually become depleted because of many years of growing of cotton and tobacco. These slaves had been purchased with debt; this debt could not be repaid with interest unless the income of the plantations was sufficiently high. However, poor harvests were not offset by sufficiently higher prices, which led to financial problems for plantation owners.
There may also have been an issue that the population, in general, was becoming poorer, essentially because of overpopulation. I say this because studies show that the height of army recruits had fallen, suggesting poorer nutrition. Sanitation had recently been improved, allowing a larger share of babies to survive to maturity. At the same time, immigration into the US continued. With overpopulation, it was difficult to keep incomes up. If farms were divided among many sons, farm sizes would tend to become smaller, leading to lower farm incomes. There would also be greater competition for factory jobs, tending to hold wages down.
Of course, when the Confederacy lost the war, the Confederate Dollar became worthless. For some, this added another financial crisis.
The Second Troubled Period was 1920 to 1940. This is a notoriously bad period, with the Great Depression and World War II included. Arguably, World War I should also be included. Commodity prices of all kinds fell very low. Tariffs were added in the 1920s. The problems seem to have arisen at the time Peak Coal hit–prices could not rise high enough to cover the cost of extracting coal from narrower and deeper seams. In my view, World War I began at the time of Peak Coal in the UK, and World War II took place at the time of Peak Hard Coal in Germany.
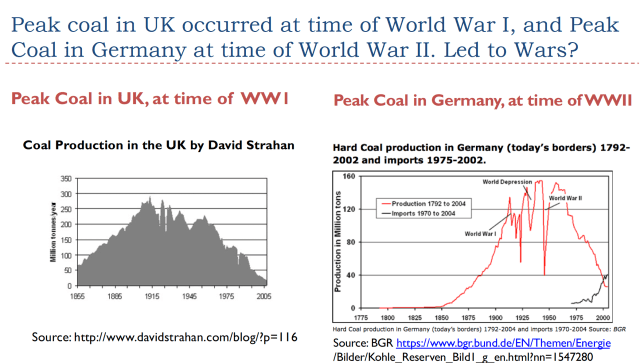
Figure 8. Chart showing coal production from my 2018 presentation.
With depletion, the cost of extracting coal kept rising, but the sales price of coal would not rise to compensate for the higher extraction costs. Instead, wages of miners were increasingly squeezed. Strikes and lockouts became common. Taking a job as a soldier seemed like a reasonable alternative.
There were many events from this period that most people would like to forget, including the currency hyperinflation of the Weimar Republic between 1921 and 1923 and the Holocaust from 1933 and 1945. Country lines were redrawn. Some countries disappeared, and new ones were added. Those holding currencies of countries that disappeared were likely left without funds.
The Third Troubled Period was 1990 to 2000.
A major event of the Third Troubled Period was the collapse of the central government of the Soviet Union, leaving the 15 republics as independent states. The collapse also indirectly affected Cuba, North Korea, and some countries in Eastern Europe that were not part of the 15 independent states. With this change, the demand for fuel of all kinds fell in the countries affected. Factories were closed in many areas, including Ukraine, which was part of the Soviet Union.
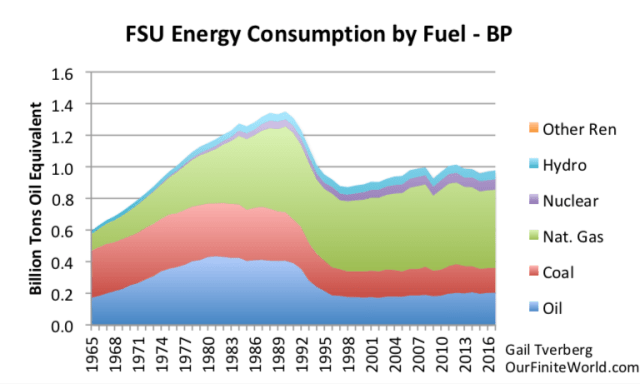
Figure 9. Former Soviet Union energy consumption by fuel, based on data of BP’s Statistical Review of World Energy 2018.
The pullback in demand from the collapse of the Soviet Union helped hold oil prices down in the 1991 to 2001 period. Oil prices had previously been brought down by the spike in interest rates in the 1980-1981 period. In my opinion, these low oil prices played a major part in the collapse of the Soviet Union. The Soviet Union, as an oil exporter, needed higher oil prices to invest in developing new fields. In my opinion, the impact of the collapse of the government of the Soviet Union kept world demand (and oil prices) low during the 1991 to 2000 period.
The collapse of the Japanese real estate bubble also took place in this period, as did the 1997 Asian Financial Crisis. Low growth in the world economy, indirectly related to the collapse of the Soviet Union, may have played a role in these financial events.
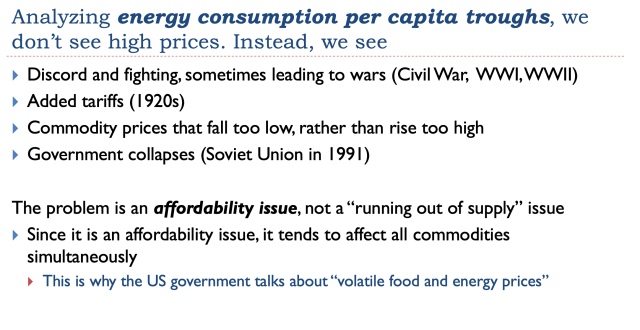
Figure 10. Slide from my 2018 presentation.
[3] The world’s self-organizing and self-healing economy
From a physics perspective, all economies are dissipative structures. Other examples of dissipative structures include ecosystems in general, all plants and animals, including humans, and hurricanes. One characteristic of dissipative structures is that, at some point in their lives, they tend to grow. Another is that if there is an injury, within a range, the systems tend to be self-healing. For example, a cut on a person’s arm will tend to heal; a hurricane going over land will temporarily lose much of its force, but it may increase in force again if it returns over warm water.
Another characteristic of dissipative structures is that they are dependent on having a sufficient energy supply of the right kinds to continue their existence. For humans, the energy supply is food; for an economy, it is a combination of many kinds of energy needed to match the built infrastructure of the economy.
All dissipative structures have finite lifetimes. Ecosystems often come to an end through fires. Humans generally do not live more than 80 or 100 years. Economies also tend to come to an end, either by losing a war or by the collapse of a central government, related to debt problems. The collapse of the Soviet Union involved a debt problem, among other issues. Figure 9 shows the huge drop in demand for energy of all types as its central government collapsed.
There is more stability of dissipative structures than a person might expect. Economists talk about an Invisible Hand being involved. Researchers examining dissipative structures talk about them being “self-organizing.” For example, if a fire or a change in climate causes a forest to collapse, it does not take many years for the forest to refill with suitable plants and animals for the somewhat changed situation. If a business or government fails, new, somewhat different businesses or governments are likely to take their place.
I would argue that if the Universe is constantly expanding (so it is an “open system,” rather than a “closed system”), what appear to be self-organizing systems may, in fact, be God-organized systems. In other words, instead of creation being a one-time event in the distant past, some type of literal higher power may be involved in a way that makes creation more or less an ongoing event. A person might wonder with the strange confluence of recent events, including the strange weather patterns associated with El Nino, whether today’s humans are being warned that a major change in economies will take place soon.
[4] What kinds of things may happen in the near future?
(a) Current disturbances in the Middle East and elsewhere are raising long-distance shipping costs for both food and oil. (See this video.) Normally, the price of food and oil must be high enough to satisfy producers and at the same time be low enough to satisfy customers. But now a new layer of costs has been added: the cost of shipping longer routes.
I would argue that because of the problem with low demand (affordability) by consumers, shipping costs must be paid almost entirely through a reduced net oil price available to oil producers and reduced net food prices available to farmers. The amount that consumers can afford doesn’t increase because of higher transportation costs.
(b) Furthermore, the use of extra oil for transportation of oil and food will tend to push the overall economy toward contraction because there will be less oil available for other uses, such as to power agricultural machinery and jet airplanes. If the overall economy begins to contract, we can expect dips in oil prices similar to those in 2008 and 2020 (Figure 1). But if recession persists, low oil prices will not reverse themselves as quickly as they did earlier.
(c) I expect home and farm prices will tend to fall around the world. This is related to the low level of demand (affordability problem) in the US and elsewhere. Figure 11, showing median US asking prices for homes, suggests that home prices have been barely holding their own for quite a while. A decrease would not be surprising with all the pressure the economy is now encountering.
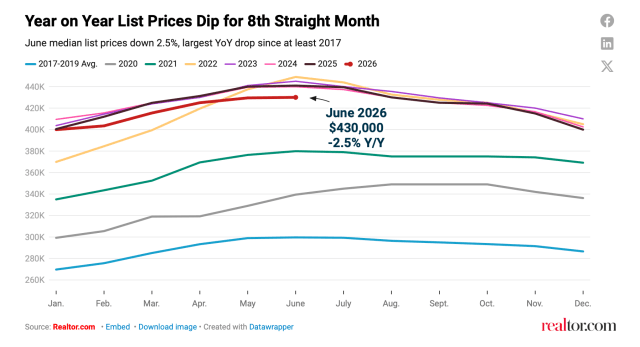
Figure 11. Comparison of US median asking prices for homes from Realtor.com through June 2026.
Farm prices are likely to be under pressure as well, because of the difficulty farmers are having obtaining adequate income from their farms. If farm and home prices fall, there is a substantial chance that the debt bubble holding up these prices will collapse.
(d) There are many other debt bubbles that seem to be waiting to collapse. Some of the debt relating to AI seems to be in a bubble. There is considerable commercial real estate whose value seems to be being held up by “extend and pretend” loans. Collapsing debt bubbles tend to lead to collapsing banks. They also tend to lead to banks less willing to make new loans. Layoffs seem likely. All these things point to a major recession ahead, with less buying power for the population.
(f) Collapses of some top levels of government, similar to the collapse of the central government of the Soviet Union, may be ahead. Such collapses can greatly reduce world energy consumption, including oil, with relatively little violence.
[5] How the nature of the economy may help over the long term
As noted previously, economies seem to have self-healing properties. Troubled periods can last for many years, but there seems to be a substantial chance that a way out will eventually be found.
If a government fails because of excessive debt, a new government (or governments) is likely to take its place. The new government will likely have fewer employees and offer fewer services to citizens. Pensions will likely need to be reduced or eliminated completely.
Even if governments fail, or national boundaries are redrawn, I expect that some businesses will continue operations. Such a situation will take place even if a new currency needs to be created to make this happen. Even in a troubled period, new businesses will start operations. Some of these businesses will make use of recycled materials available from failing businesses.
According to the Maximum Power Principle, if there are resources available that can easily be used, somehow, some organization will develop a way to use them. Over the long term, the economy will likely re-organize itself in a way that is more complex and more sparing in energy use. If energy use is efficient enough, it seems likely that a higher price for that energy supply could be made affordable to consumers. But, such a transition may take many years, if it is possible at all.



Comments
Log in or sign up to join the conversation.