


Adobe (ADBE) remains in a well-defined bearish structure that has been in place since the start of the year, extending the broader corrective decline from the prior major cycle high. Price action continues to align best with a higher-degree wave C decline, with the current move potentially representing the final wave five leg of this sequence.
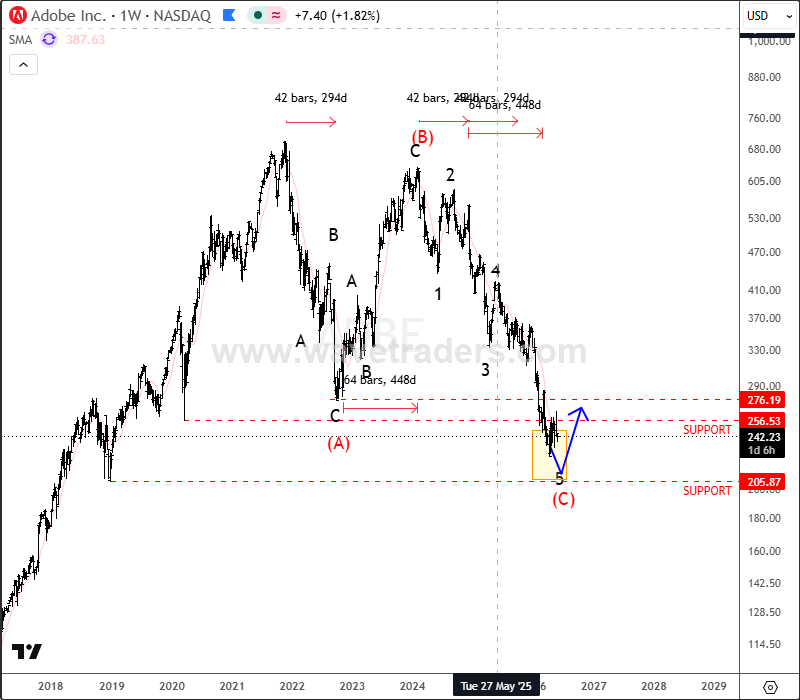
On both the weekly and daily charts, the trend remains decisively downward, with all significant rallies so far developing in corrective form rather than impulsive reversal structures. The rebound from the April lows has not shown strong impulsive characteristics, suggesting it is more consistent with a fourth-wave correction inside a broader downtrend rather than the beginning of a durable bullish reversal.
The March gap around the 268 region remains a key technical reference point. This zone has acted as strong resistance, and recent price behavior confirms that sellers continue to defend this area. As long as price remains below this level, upward movements are more likely to be corrective retracements within a broader bearish continuation.
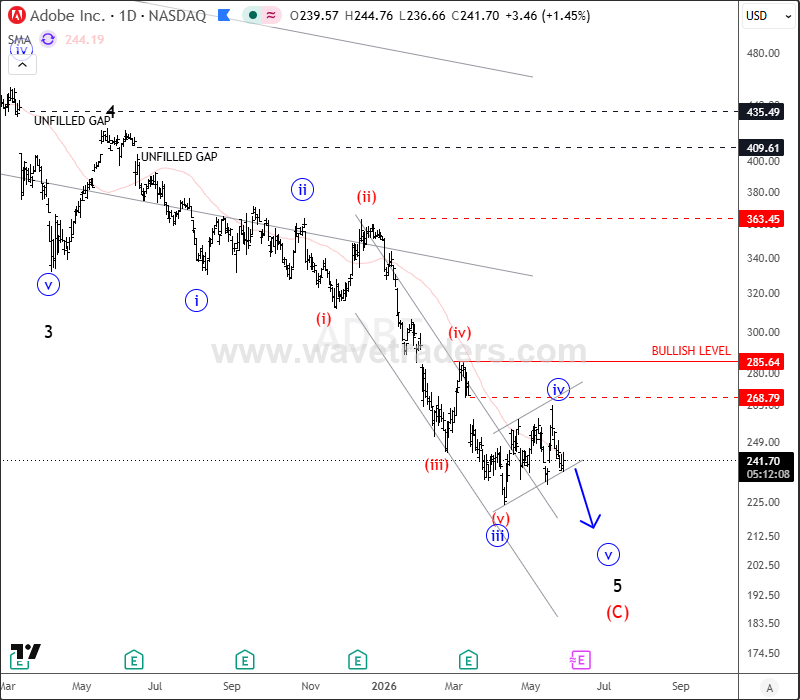
From a structural perspective, the market still appears to be progressing through the final stages of a wave five decline. If this interpretation is correct, downside momentum may persist before full exhaustion is reached. Only after completion of this final leg would a higher-probability base formation or trend reversal scenario begin to emerge.
On the downside, the 200 region remains the most important longer-term support zone to monitor. This area carries both psychological and historical significance and could attract stronger demand if selling pressure extends into a capitulation-like phase.
Highlights:
Adobe is approaching the final leg of a broader bearish wave C structure
Recent rebound from April lows still appears corrective, not impulsive
The 268 zone (March gap) remains a key resistance area defining bearish control
Longer-term support and potential stabilization may develop closer to the 200 region
Overall, the structure continues to favor downside continuation until clear evidence of impulsive strength and sustained resistance breaks appear.



Comments
Log in or sign up to join the conversation.