
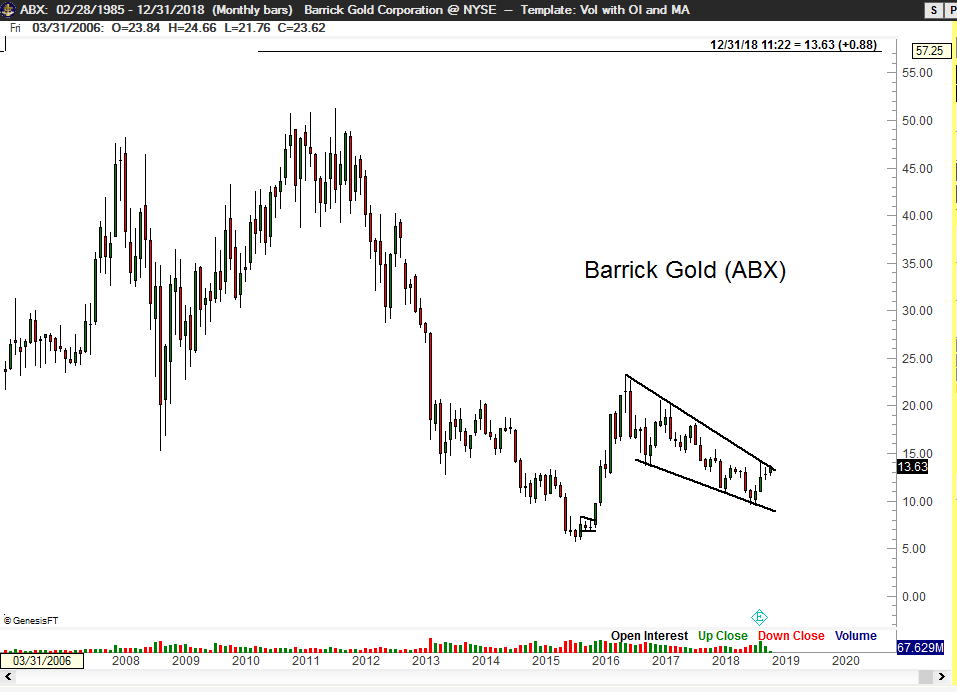
I have featured Barrick Gold Corporation (NYSE: ABX) in recent Factor updates as a possible proxy play on Gold. The monthly chart exhibits a 28-month falling wedge. Remember that a falling wedge is a diagonal pattern and subject to less reliability and trickier breakouts.
(Click on image to enlarge)
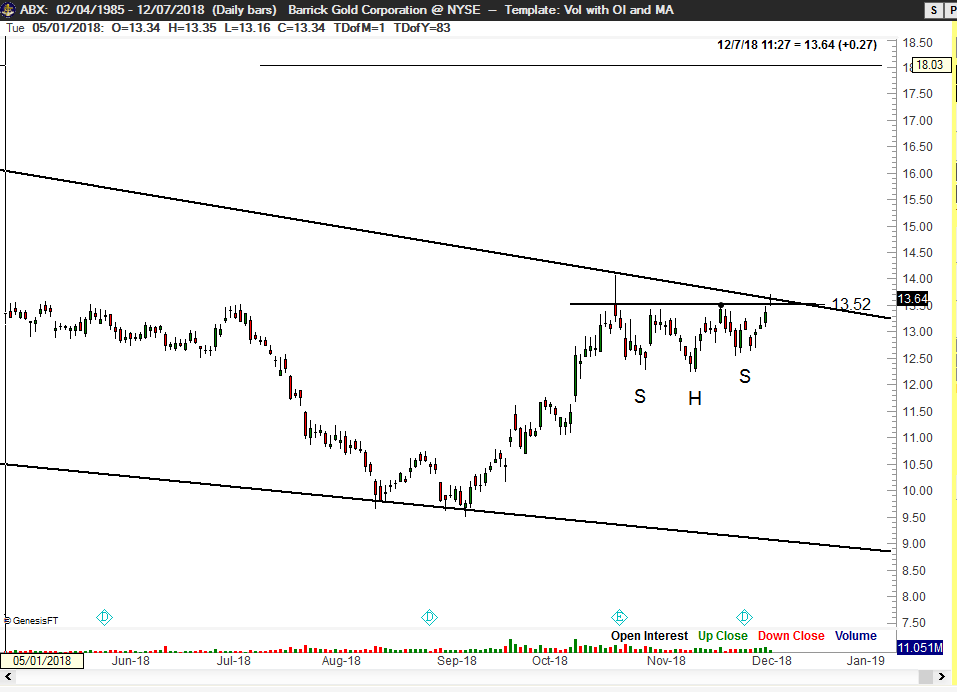
The daily graph on ABX (Barrick Gold Corporation) displays a possible 7-week continuation H&S pattern. Price broke out of this H&S on Friday, triggering a potential target on ABX of $18.14.
(Click on image to enlarge)


Comments
Log in or sign up to join the conversation.