

In this series we scale-back and take a look at the broader technical picture to gain a bit more perspective on where we are in trend. Here are the key levels that matter on the commodity bloc heading into the yearly close.
Gold Weekly Chart
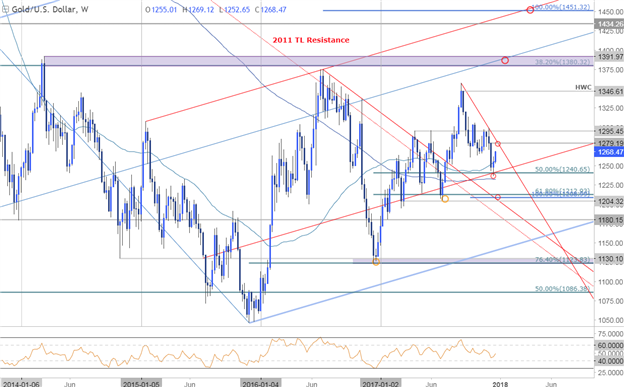
Notes: Gold prices rebounded off critical confluence support last week at 1240 with advance now eyeing initial resistance at the November high-week close / 2017 trendline resistance at ~1279. Heading into the open of 2018 trade, the focus remains weighted to the topside while above the December lows with broader bullish invalidation down at 1204/08. A breach higher from here still has to contend with the April swing highs at 1295.
Bottom line: We’ll be looking to fade weakness while above 1240 heading into the start of the year with a breach above 1295 needed to mark resumption of the broader uptrend in Gold prices. Such a scenario targets subsequent resistance objectives at the 2017 high-week close at 1349 backed by 1380/92.
Copper Weekly Chart
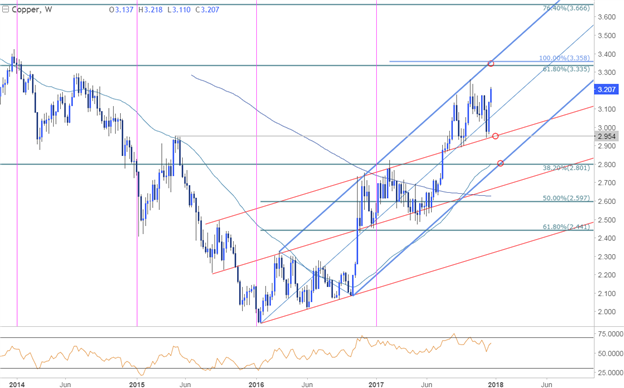
Notes: Copper prices have continued to trade within the confines of a well-defined ascending pitchfork formation extending off the 2016 lows. A breach above the 2017 yearly opening range in July fueled a rally into the upper median-line parallel which capped the advance back in October. A parallel extending off 2015 September high (red) has continued to offer near-term support with prices rebounding off this mark earlier this month. Note that continued bearish divergence highlights the risk of a near-term pullback here.
Bottom line: Heading into the yearly close I’ll be looking for a final exhaustion rally into the 3.33/36 before a larger correction. This zone is defined by the 100% extension of the 2016 rally & the 61.8% retracement of the 2011 decline and converges on the upper median-line parallel into the 2018 open. Interim support rests at 2.95 with broader bullish invalidation down at 2.80.
Crude Weekly Chart
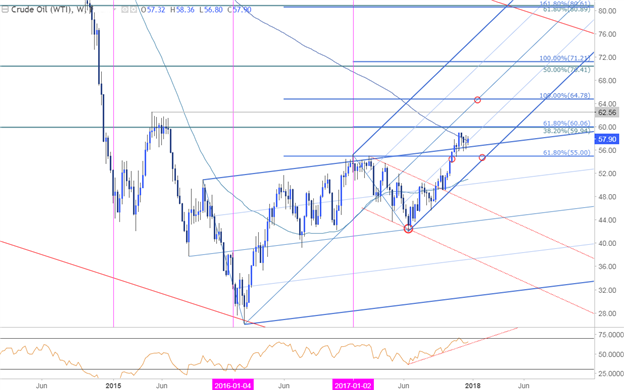
Notes: Crude prices have continued to consolidate just above the upper median-line parallel of the broader pitchfork we’ve been tracking since early 2016. The immediate focus is on a break of this consolidation range with the broader outlook weighted to the topside while within the embedded pitchfork extending off this year’s low. A breach eyes initial targets at the 59.94-60.06 Fibonacci confluence backed by the 2015 high at 62.56 and the 100% extension at 64.78.
Bottom line: we’ll favor a topside breach of this consolidation heading into 2018 while noting near-term support at 55 and broader bullish invalidation at the lower parallel / 52-week moving average at ~51.00/50. Review a breakdown of the near-term levels in my latest Crude Oil Scalp Report.



Comments
Log in or sign up to join the conversation.