
On Friday the BLS reported, among other things, that full-time employment in April had dropped by 252,000 from the prior month and that the weekly earnings of production workers had risen by the grand sum of 67 cents (0.1%) before inflation and taxes. But why should still another confirmation that the main street job market is dead in the water stop the robo-traders from another romp higher?
In fact, this incongruous spectacle of dead wages and soaring financial assets has been going on for several decades now——a transparently obvious trend obfuscated by the unrelenting recency bias of the MSM and the authorized Wall Street/Washington narrative. So let Friday’s incongruous stock market rip serve as a portal into the ugly interior history of how central bank bubble finance has fostered an existential crisis in what remains of American capitalism.
On the main street side, this isn’t a matter of sluggish recovery from a mysterious financial crisis that arrived, apparently, on a comet from deep space in September 2008. Alas, for three decades running now, the constant dollar weekly wages of full-time workers have been flat as a pancake.
And let’s be clear. We are not talking here about after school jobs held by quasi-perpetual students, the meager pay of moonlighting moms or the episodic work gigs of society’s tens of million of loosely attached drifters.
To be sure, the ranks of these marginal job holders have become immense according to the Social Security Administration’s most recent authoritative data—– and it is “authoritative” compared to most of Washington’s statistical mill flotsam because its based on the payroll records of millions of employers who generally do not withhold taxes from ghosts. To wit, there were about 50 million low wage job holders (under $15k/year) who as a group earned an average gross pay of just $6,000 in 2013. So unless there is wholesale violation of the minimum wage laws, upwards of one-third of the US labor force of 155 million is working about 15 hours per week at the lowest lawful pay rate per hour.
Call that a giant social problem. In truth, however, its not the half of the real crisis. The latter is shown in the graph below, which is for “full-time” workers defined by the BLS as being on the job at least 35 hours per week.
Thirty years after it was ostensibly “Morning in America”, full-time wage workers have gained only 0.1% per annum in their weekly pay envelope. That’s a rounding error—even if you believe that the BLS’ statistical shenanigans have actually captured cumulative inflation since 1986. In the real world, of course, actual inflation is much higher—-so real wages have self-evidently been sinking for 30 years.
![]()
1986-2015 CAGR……..0.1%
Nor does this stagnant trend in real wage rates tell the entire story. The Friday “jobs” report also showed that the share of the prime work age population holding any kind of job—–even a few hours per week “coding” or delivering pizzas—–is now down by fully 10 percentage points from the level it gained after women had fully entered the labor force in the 1990s.

Needless to say, even as the main street economy of work and production has been going nowhere, the financial system has erupted skyward. During the last 35 years according to the Fed’s flow-of-funds calculations, the sum of credit market debt outstanding plus the market value of equities has soared from $6 trillion to $95 trillion or by 15X. By contrast, since 1981 the nominal GDP has risen by only 5X.
This is “financialization” in its full brobdingnagian aspect. A financial sphere which had occupied 212% of GDP in 1981 now weighs in at 537%. And, no, the starting figure does not represent some temporary, aberrant low bequeathed by the hapless Jimmy Carter; the 1981 ratio was actually the historic norm. During the halcyon times of 1955, for instance, the sum of credit market debt and equity market value actually posted slightly lower at 197% of GDP.
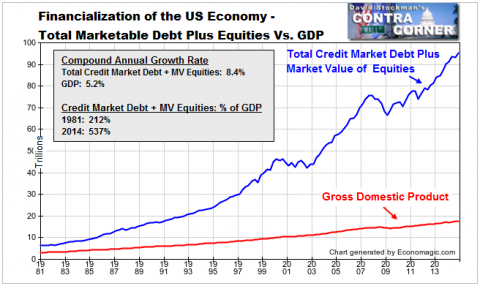
Total Marketable Securities and GDP
So the elephant in the room is the nearly $90 trillion of gain in financial market value during the last 35 years. In a word, it represents a heaping pile of inflation - both the traditional CPI kind and the new style financial inflation inaugurated by the Greenspan Fed, as well.
Stated in constant 2015 dollars, real GDP was $7.2 trillion in 1981, meaning that it has grown by about 2.5X over the last three and one-half decades to $17.7 trillion at present. All the rest of the 15X gain in financial market value since then is not reflective of capitalism, or human greed or even “deregulation” at work. This is the baleful handiwork of a rogue central bank.
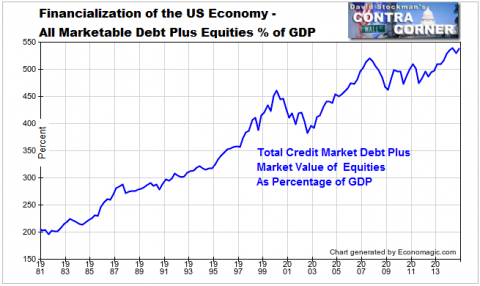
Total Marketable Securities % of GDP
How did this massive inflation of the financial sphere happen? In a word, financial repression and the doctrine of wealth effects.
Since the time of Greenspan’s abject panic in the wake of Black Monday in October 1987, the Fed has chronically pegged the money market rate below market clearing levels, thereby fueling an embedded carry trade that has mushroomed relentlessly. And this isn’t just about the record $485 billion or margin debt outstanding or even the several trillions of repo trades that are captured by current reporting systems.
No, the entire financial system is infected by the endemic carry trades which result from falsification of the money market by the Fed. Upwards of $50 trillion of futures and options contracts are all mispriced, for example, owing to the pegging of money market rates at zero percent for the last 7 years and at a fixed, below-market rate for the past 30 years. The economic evil is as much in the pegging as in the zero bound level because it is the powerhouse peg of the fed that reduces the risk of carrying financial assets with cheap short-term borrowings.
And the wealth effects doctrine only compounds the deformation. That is, it reduces the price risk of carrying financial assets with high levels of repo or options leverage because of the Fed’s “put” under the market. The latter, of course, is an anomalous artifact of bubble finance which is believed by nearly 100% of the gamblers but denied by virtually all of the money printers.
But the proof is in the pudding. Downside hedges (i.e. puts on the S&P 500 in their most basic form) are dirt cheap owing to the willingness of market makers collect nickels on downside insurance, knowing that the Fed is pledged to keep the steamroller of 10-20% market breaks at pay. Indeed, the S&P path shown below could not happen in a free market—–even one with far more healthy fundamentals that the floundering recovery of the past six years:
![]()
Then throw into the mix the Fed’s severe interest rate repression in the bond market and you get more financial inflation. When debt is priced drastically below its economic cost and receives a deep tax code subsidy to boot, a variation of the supply side theorem plays out. Namely, when the cost of servicing capital is made artificially low, you get a lot more of it.
In that regard, consider the explosion of corporate bond issuance, which in 1981 amounted to just $550 billion or a mere 17% of GDP. Today that figure is $11.6 trillion or 20X larger and amounts to 65% of GDP. Yet self-evidently, that explosion of new borrowings did not go into the acquisition of productive assets. If it had, real GDP would have grown a lot more rapidly than the 2.7% rate recorded for the 33 years ending in December 2014.
Instead, the debt was overwhelming used for financial engineering—-or what is ultimately a Ponzi scheme by which new corporate borrowing are used to shrink the outstanding float of stock so the carry trade gamblers can bid up the secondary markets in equities to ever higher levels.
Not surprisingly, therefore, the US corporate sector’s market capitalization has exploded from $2 trillion in 1981 to $48 trillion at present. That right. The nominal value of corporate debt at par plus equity at market has risen by 24X, and most of that gain has occurred since the inauguration of monetary central planning under Greenspan in October 1987.

Total Corporate Securities and GDP
The above graph surely hints at the dangerous instability fostered by bubble finance. And it is not by happenstance that the Greenspan Fed essentially threw in the towel when it authorized sweep accounts on banking deposits in the early 1990s. Not only does this mean that required reserves in the banking system now amount to a laughable, microscopic 0.4% of deposits, but the whole apparatus of is irrelevant anyway because banks are only a minor source of new credit in the system.
What central bank bubble finance has actually unleashed is a self-fueling form of market asset based credit creation. The options, futures and currency markets, for example, are based on what amounts to loans which are collateralized by small fractions (1-10%) of the underlying’s current market value. As valuations rise ever higher, collateral values follow and implicit leverage grows. It is a financial beanstalk.
At the end of the day, the collateral based finance embedded in the current $95 trillion level of US credit and equity outstanding is far more dangerous than the old fashioned fractional reserve lending of the pre-1990 banking system. At least under the old regime, bank regulators and central bankers like Volcker were stepped in the tradition of sound and safe banking.
By contrast, the post-Greenspan central bankers have opened a Pandora Box of market based hypothecated-finance and do not have a clue about the enormous bubble they have unleashed. Nor do they understand that this $95 trillion monster is a rent-seeking vampire squid that makes Goldman Sachs look little a piker. That is, the relentless trading, churning and synthesizing of assets and derivatives within the giant bloated system of finance has almost nothing to do with raising or allocating capital for productive use.
Instead, it is the arena where honest savings from the household and business sectors go to be scalped and appropriated by the hedge funds, dealers, financial engineers and gamblers which populate the casino.


Comments
Log in or sign up to join the conversation.