

Maybe we’re dating ourselves here, but if you ever had a record player, you know the frustration of a scratched album. As the record plays, the needle suddenly hits that groove (not in a good way), and you keep hearing the same three seconds of the song on an endless loop. Mood ruined.
We couldn’t help but remember those days while looking at the chart below from page two of today’s Morning Lineup. While the S&P 500’s 50-day moving average typically oscillates, the “scratch” of the war in Iran has locked the market in a repetitive, oversold groove, killing the vibe for bulls.
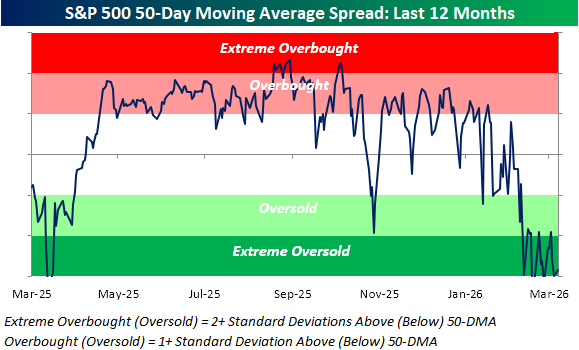
Even after this morning’s gain, the S&P 500 is still on pace to close at least 1.5 standard deviations below its 50-DMA for the 19th straight trading day. The streak will remain intact unless the S&P 500 rallies more than 3.2% for the day (it’s up 2% as of this writing).
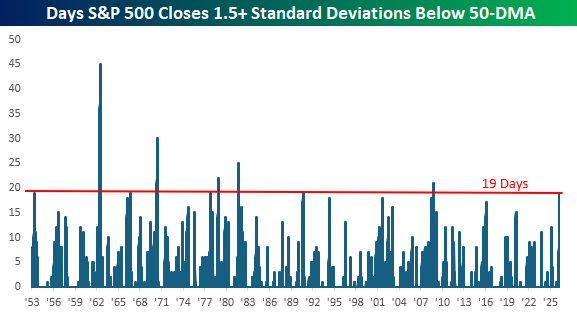
The chart below shows prior streaks of closes 1.5 or more standard deviations below the 50-DMA. As shown, the current streak ranks as the longest in nearly 20 years (October 2008 at 21 days), and before that, August 1990, when Iraq invaded Kuwait, causing another major disruption in global energy supplies.
While these types of streaks have been rare in recent decades, they were much more common from the 1960s to the early 1980s. Ironically, that’s also a period considered the golden age of records!
Want to see exactly where these rare events have occurred throughout market history? Today’s full Chart of the Day includes a long-term view of the S&P 500 that highlights each prior occurrence with red dots, giving you the full historical picture of when the market has found itself in situations like the one we are in right now.


Comments
Log in or sign up to join the conversation.