

Written by Ben Carlson
There is plenty of investment research available to investors today. Some of it is biased. Some of it is useful. What you need is a good filter just to decipher what’s worth reading and what you’re better off ignoring. Here’s my quick and dirty guide for what constitutes high-quality investment research and some examples.
Understand the data being used. There is no perfect historical market data. Many of the databases contain errors or need context to understand what they’re actually showing. Financial market data before the 1980s or so is incomplete, to say the least. The person or firm presenting the data must understand exactly what they’re working with to look at things in a fair and balanced manner.
Data should be robust. You can show almost any relationship you want if you do enough digging within your dataset. Robust data works across multiple settings and can be updated to be useful in the future.
Data is useless without context. Numbers don’t mean anything if you can’t recognize their possible limitations or the fact that investors don’t always utilize them correctly. When trying to handicap the markets you always have to consider where you could be wrong and why your research could prove to be misguided. Markets are ever-changing so providing an honest assessment is always an intelligent move.
You must see the other side. Far too much research begins with a conclusion and then finds data to back it up without ever considering any alternatives. Useful research should always offer a wide range of outcomes to show where or why the conclusion could be wrong.
Probabilistic thinking. Market research should help investors weigh the benefits of being right with the consequences of being wrong. Thinking in a probabilistic fashion is an intelligent position to take when dealing with an unknowable future.
Let’s take a look at an example to see useful investment research in practice. Norbert Keimling of Star Capital in Germany produces some really high-quality research pieces. This chart shows the long-term return distribution of a number of different countries since the late-1800s:
(Click on image to enlarge)
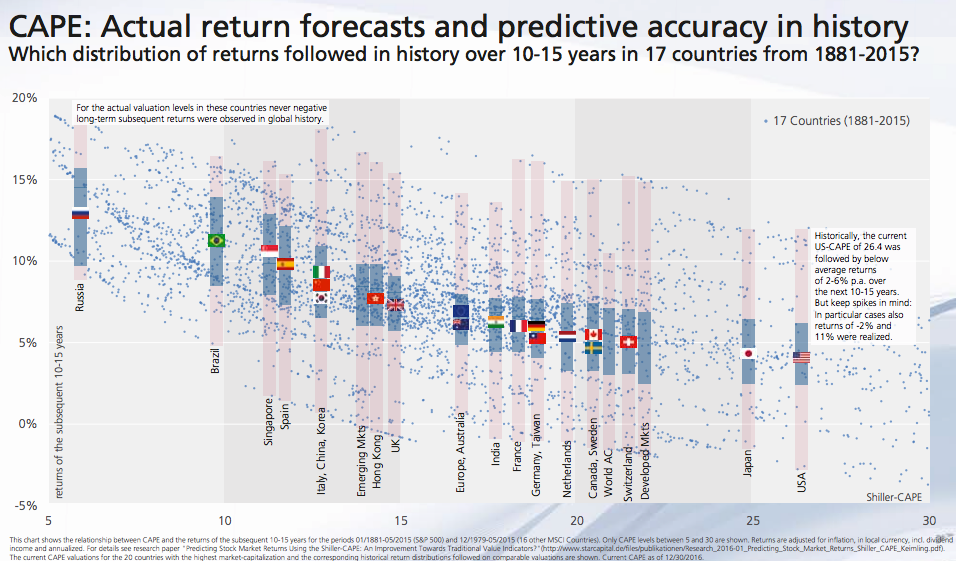
Not only is this a visually striking chart, but the simple takeaway is that lower starting valuations tend to lead to higher future returns and higher starting valuations tend to lead to lower future returns. The research is also presented across a number of different markets and shows a wide range of results.
Keimling also has a graph that shows the average downside risks from different valuation levels:
(Click on image to enlarge)
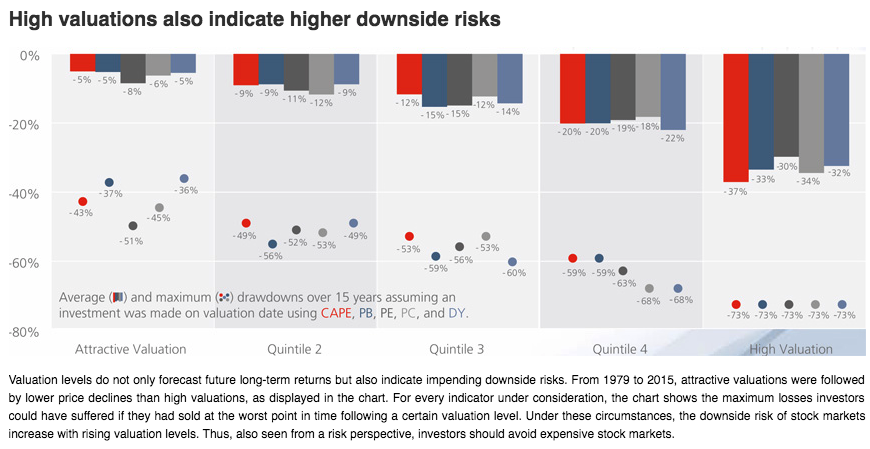
The main takeaway here is that there have been much larger stock market losses from higher valuation levels, on average, than lower valuations. He also breaks this chart down by five different valuation metrics to go beyond single variable analysis.
One of the problems with market valuations is that they can be a blunt instrument. “On average” does not mean every time and market structure and environment can have a lot to do with the usefulness of any historical valuation measure. As a follow-up to their valuation research, Star Capital also took a look at the possible drawbacks of their CAPE valuation metrics used:
(Click on image to enlarge)
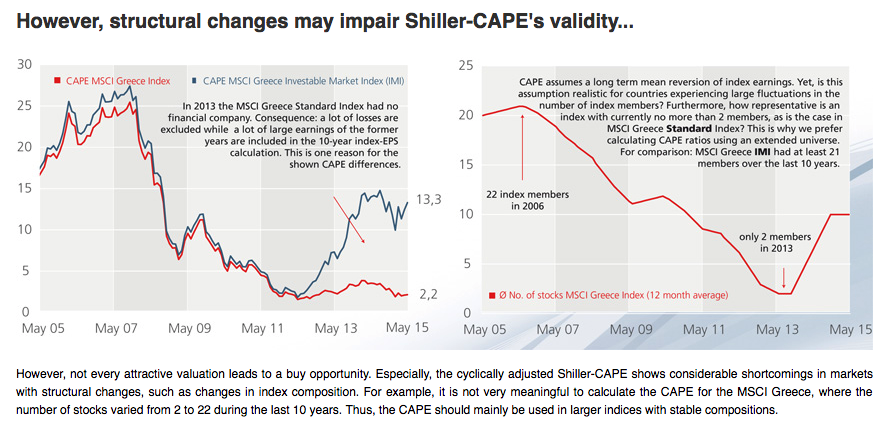
The idea here is that structural changes in the markets over time can have a huge impact on the interpretation of valuation measures. Changes in sector composition in the markets can also have an impact on the usefulness of historical valuations:
(Click on image to enlarge)
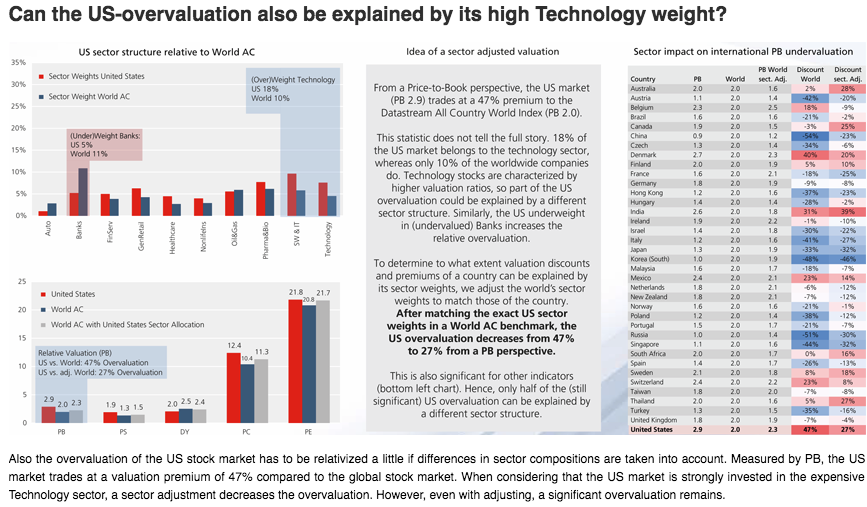
One of the problems with trying to compare valuations across different markets and geographies is that different markets often have different underlying sector make-ups, which also change over time. For example, U.S. markets have a much higher weighting to technology than foreign markets, which makes them different from other markets around the globe.
I really like this type of research because it provides:
- interesting and useful information.
- context around a complex topic.
- a wide range of results in the underlying data.
- a look at the other side of the argument to see where the original research could be misinterpreted or inaccurate.
- investors the option of coming to their own conclusions.
There is plenty of investment research available to investors today. Some of it is biased. Some of it is useful. The most important thing for investors is to understand that it’s your interpretation of the research that’s out there that matters. Two investors can look at the same research piece, chart or table and come to two very different conclusions based on their interpretation of what it means.
Access to high-quality research can help, but how you interpret the firehouse of information available at your fingertips will have the largest impact on how you apply it to the markets.


.webp)
Comments
Log in or sign up to join the conversation.