
For the second time in 2018, I find the S&P 500 (Index: SPX) in Lévy flight.
The first time kicked off as soon as the stock markets opened in 2018, which lasted to the third week of the month, as investors shifted their forward looking attention from 2018-Q2 to the more distant future of 2018-Q4 in response to the stimulus of tax cuts being implemented in 2018.
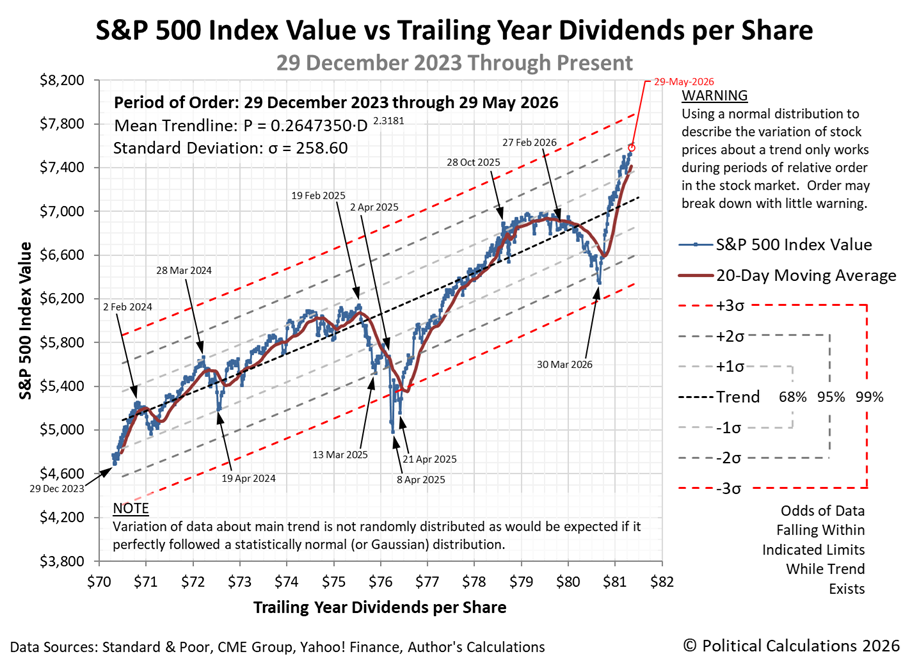
But in the final week of January 2018, and really, mostly on Friday, 2 February 2018 (since more days of the week belong to January, we consider it to be Week 5 of that month), investors appear to be finding reason to return their forward-looking attention back to the nearer term future defined by the expectations associated with 2018-Q2. The result is another comparatively large movement in stock prices over a comparatively short period of time, but this time, with stock prices moving in a downward trajectory.
(Click on image to enlarge)

This isn't the first time that we've seen successive Lévy flights occur within a relatively short period of time. For us, the classic, almost textbook example occurred in late August 2015, where stock prices suddenly plunged by 10% in the third week of that month as investors shifted their forward-looking attention from 2015-Q3 to 2016-Q1, before rebounding by over 6% in the following week when investors shifted their focus back to 2015-Q3. In the two months after that, there was another Lévy flight crash and rally that both played out over a slightly longer period of time before volatility in the market settled down.
It's definitely not the kind of normal random walk that Louis Bachelier or Paul Samuelson theorized, although they were close to being on the right track. It's much better thought of as a quantum random walk, where the number of large, sudden changes in stock prices are greater than would be predicted by Gaussian statistics, and if it seems like the market is behaving chaotically, that is because it is.

Comments
Log in or sign up to join the conversation.