

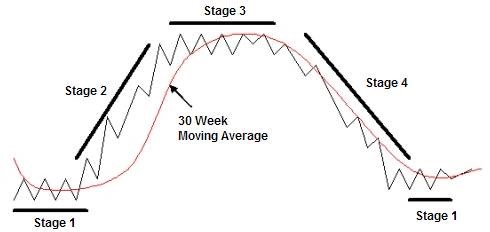
When actively trading the stock market it's important to have realistic expectations for how stocks and the overall market behave. That’s one of the reason I use Stage Analysis, human emotion and its influence on supply and demand doesn’t change over time, and we see the same pattern (the 4 stages of Stage Analysis) repeat over and over in the market.
When thinking about market corrections I like putting them into 3 buckets, 5%, 10%, and 20+% corrections (a 20+% correction is also commonly referred to as a bear market). The table below shows 10% and 20+% corrections since 1928 (minus the late 2018 correction).
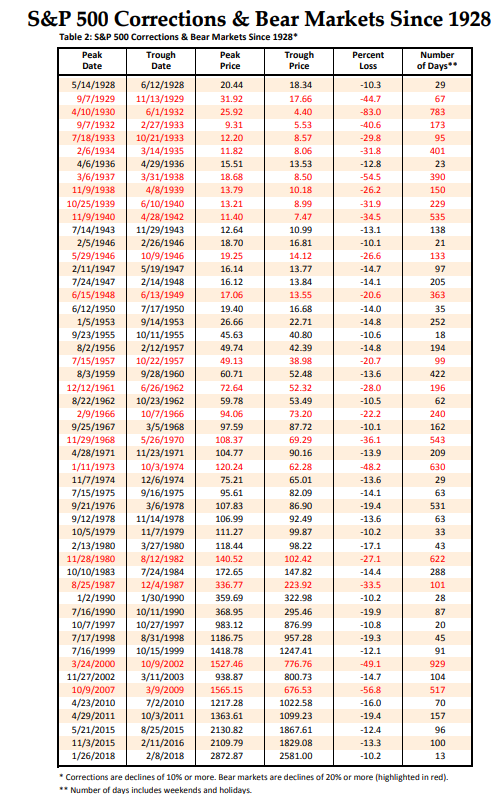
Source: Yardeni Research
The next table shows 5%+ corrections since the March 2009 low. As you can see when you drop to that threshold you get much more frequent activity.
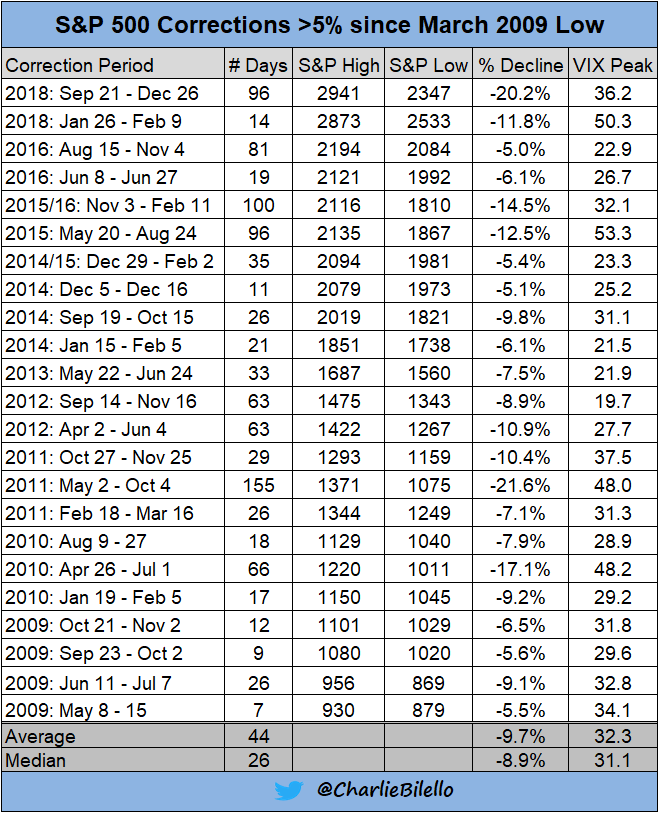
Source. @charliebilello on Twitter
From this data the basic framework I've created for stock market corrections is the following:
- 5% corrections happen almost every year, and we can expect on average 2-3 of them a year.
- 10% corrections can happen once a year every year or every few years.
- 20+% corrections are more rare and the market can go a long time between them, 10+ years in some cases or sometimes just a few years.
So, in general, we should be expecting to see a few 5% corrections a year. Even a 10% correction should basically be expected but should happen fewer than 5% corrections. A 20+% correction is a more rare event that we can expect to have multiple years between.
5% corrections are essentially profit taking events when the market is in Stage 2 and enough selling pressure comes in to bring the market back down to the 30-week MA. The course of action I like to take for 5% corrections is to reduce position sizes, that keeps me exposed to the market but lessens the blow of a market pullback.
Comments
Log in or sign up to join the conversation.