

Summary
- The yield's mid-course pause is almost over; we should see more yield decline thereafter. But it does seem a limited downside for yields, maybe just one or two more days.
- We're on the lookout for levels to exit short equities positions. Nominal levels of the Fed's balance sheet, bank reserves and TCB have risen; yields and equities should rise soon.
- The sharp tightening of financial conditions in China is signaling that the end of the crypto bull phase is over, for now. Liquidity from China is what is powering cryptos.
- Mr. TK has inquired about my level of confidence for a peak sometime soon, given the background newsflow of impending stimmy and given the overwhelming bullishness of the market. The latter, I actually take as a negative -- I have seen (and was at work) during the peak day of the 2000 and 2008 bullmarkets. There was nothing but euphoria, FOMO, BTFD, Dow to 100,000 environment, during the very day of the absolute tops. So that bullishness does not count.
- It is the stimmy that has more substance. However, the US Congress is a strange beast, so approval of the stimmy bill, as currently drawn, is definitely not a given. There will be a stimmy bill, but in what form, and when, are the known unknowns. Also our tools are telling us this bear phase development SHOULD happen. I don't know if those projections will come to pass, but so far, the tools have been (to me) better than sticking a wet finger to the wind.
JANUARY 26, 2021
GOOD MORNING ASIA / GOOD EVENING EAST COAST
robert.p.balanModeratorLeaderOwnerJan 26, 2021 3:36 AM
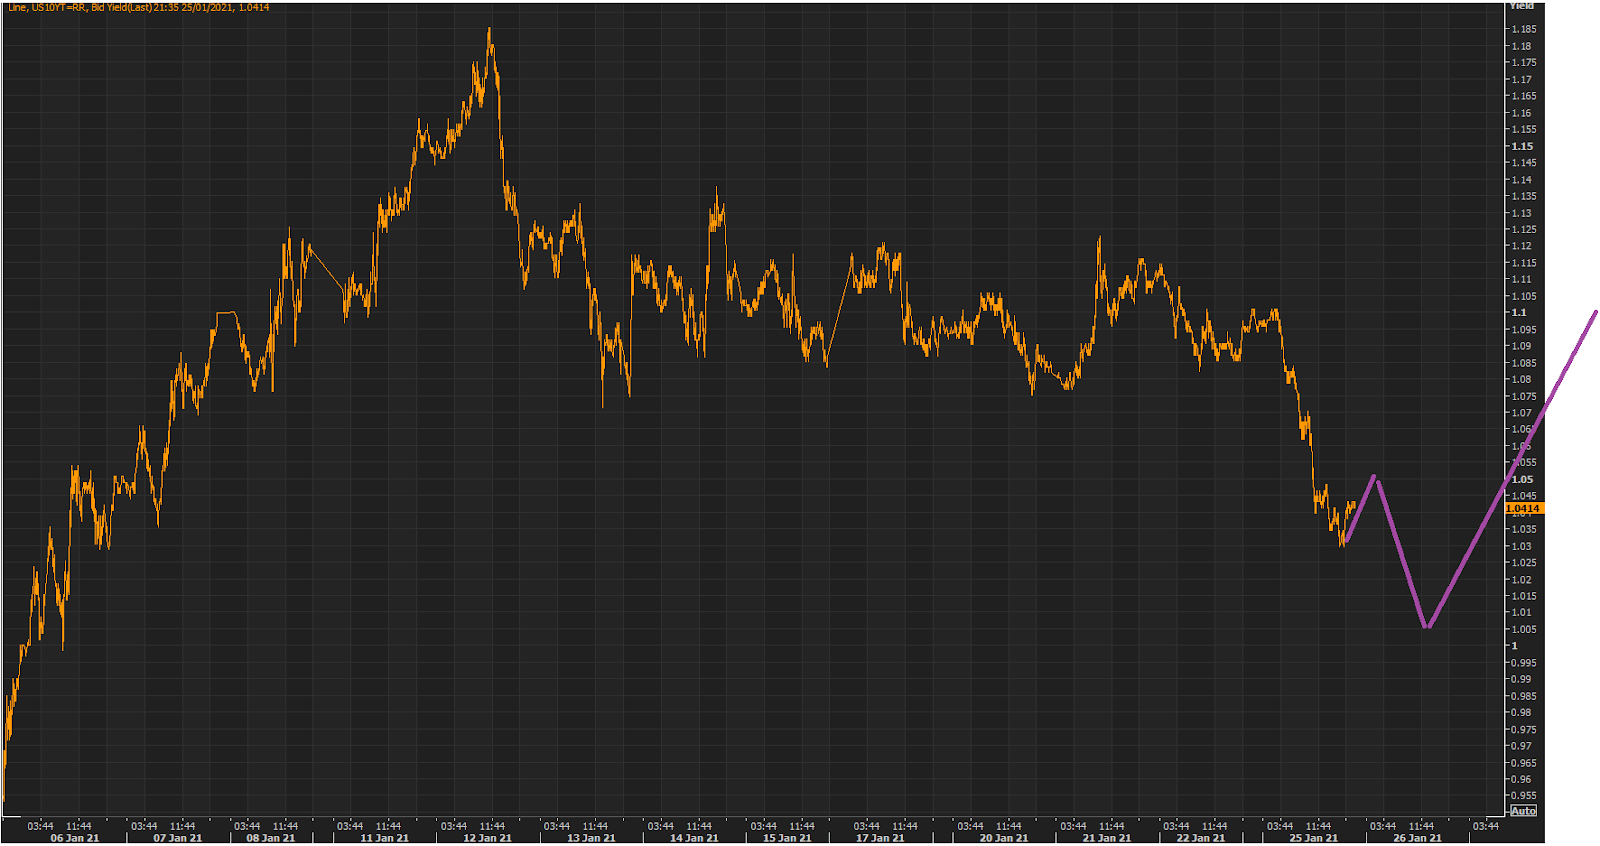 The yield's mid-course pause i almost over, and we should see more yield decline thereafter.
But it does seem a limited downside move for yields. maybe just one or two more days. We are on the lookout for levels to exit short equities positions.
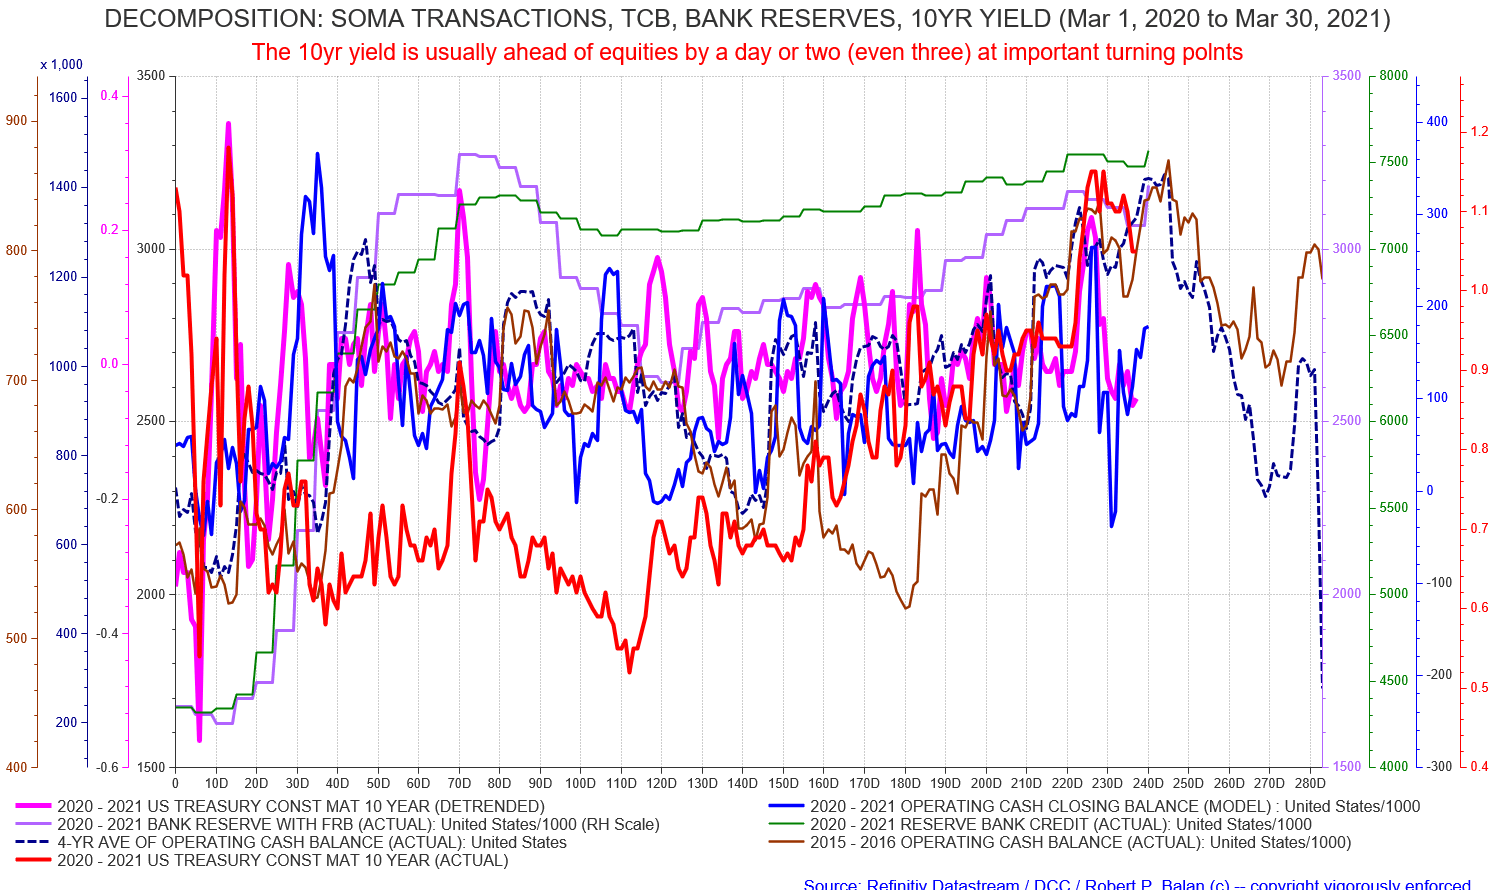 Given that the nominal levels of the Fed's balance sheet, bank reserves and TCB have risen, yields and equities should catch up on the upmove very soon.
That of course sets us up for a peak 9 to 10 trading days from now. That is being corroborated by a pure TCB based modeling, using nothing more than the seasonality of the TCB.
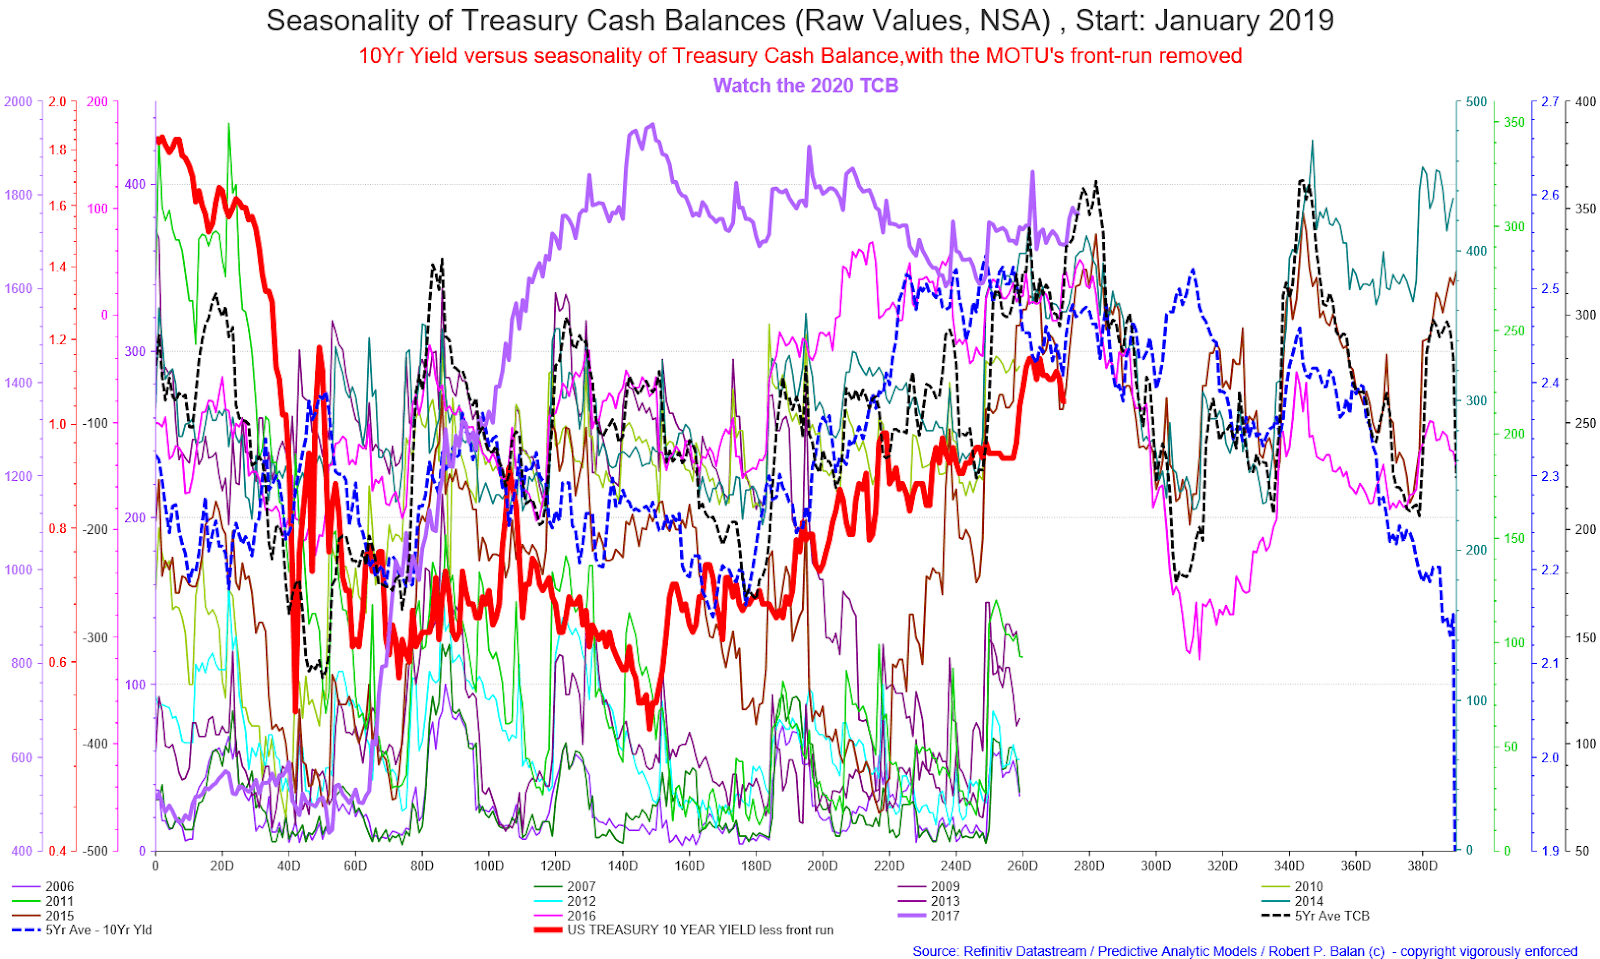
Mr. TK has inquired about my level of confidence for a peak sometime soon, given the background newsflow of impending stimmy and given the overwhelming bullishness of the market. The latter, I actually take as a negative -- I have seen (and was at work) during the peak day of the 2000 and 2008 bullmarkets. There was nothing but euphoria, FOMO, BTFD, Dow to 100,000 environment, during the very day of the absolute tops. So that bullishness does not count.
It is the stimmy that has more substance. However, the US Congress is a strange beast, so approval of the stimmy bill, as currently drawn, is definitely not a given. There will be a stimmy bill, but in what form, and when, are the known unknowns.
And the RobinHooders are such strange, gratification-craving bunch that any temporary hiccup to their stimmy expectations might just trigger something unsavory.
Also our tools are telling us this bear phase development SHOULD happen. I don't know if those projections will come to pass, but so far, the tools have been (to me) better than sticking a wet finger to the wind.
So we will give the tools the benefit of the doubt.
robert.p.balanModeratorLeaderOwnerJan 26, 2021 4:14 AM
More food for thought.
Equities are reaching a time when some untypical corrections have been seen over the past several years.
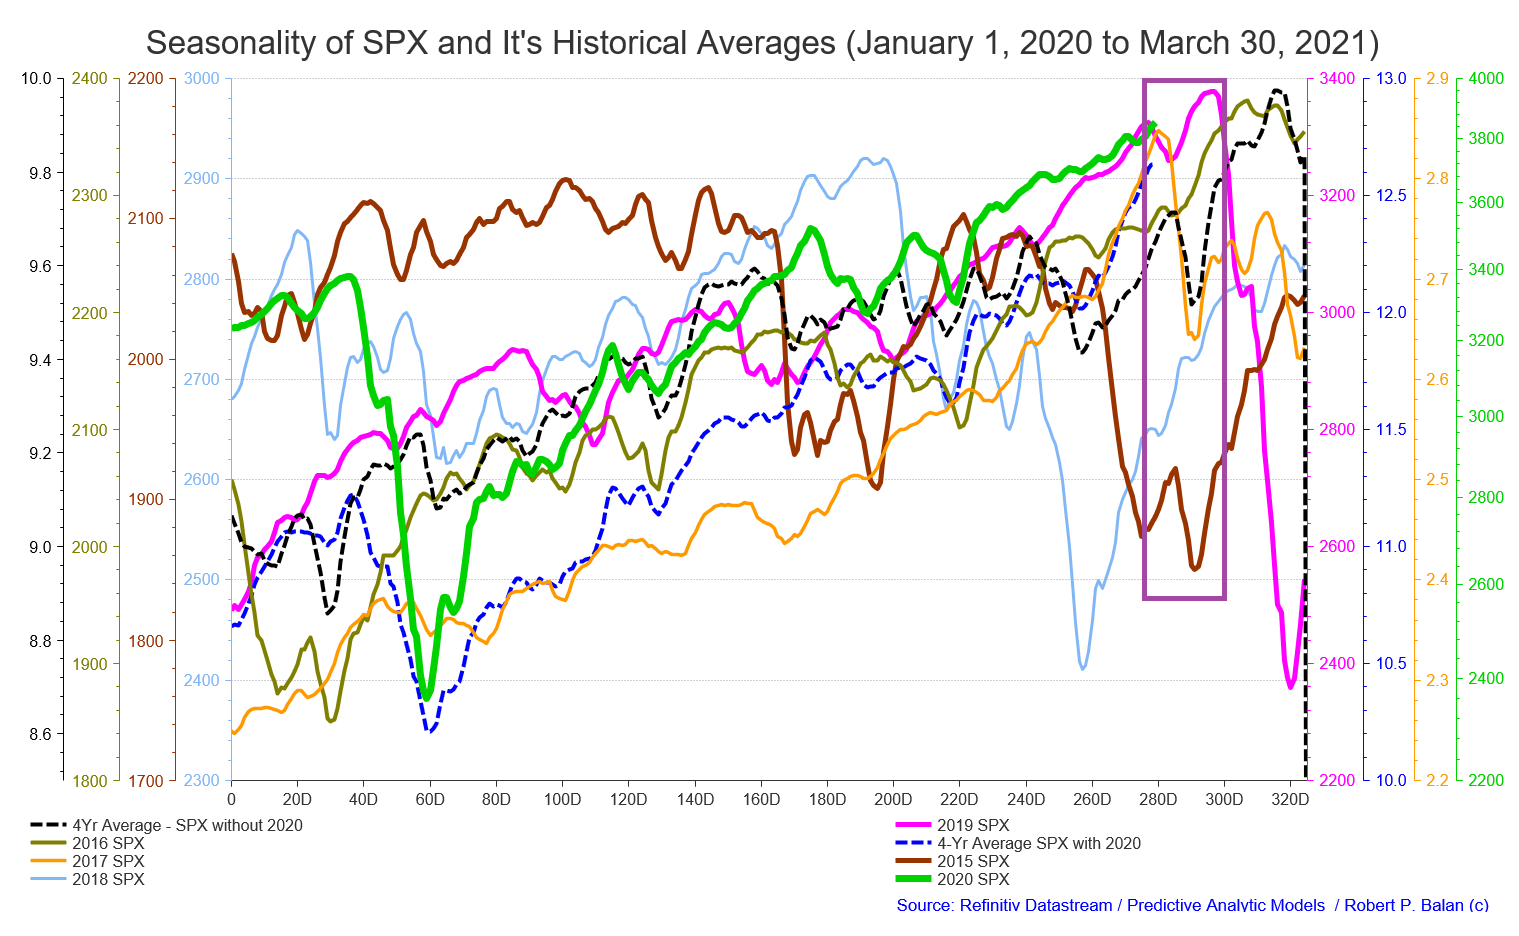 Bond yields have almost always shown a strong seasonal tendency to fall during this time of the year, in most years.
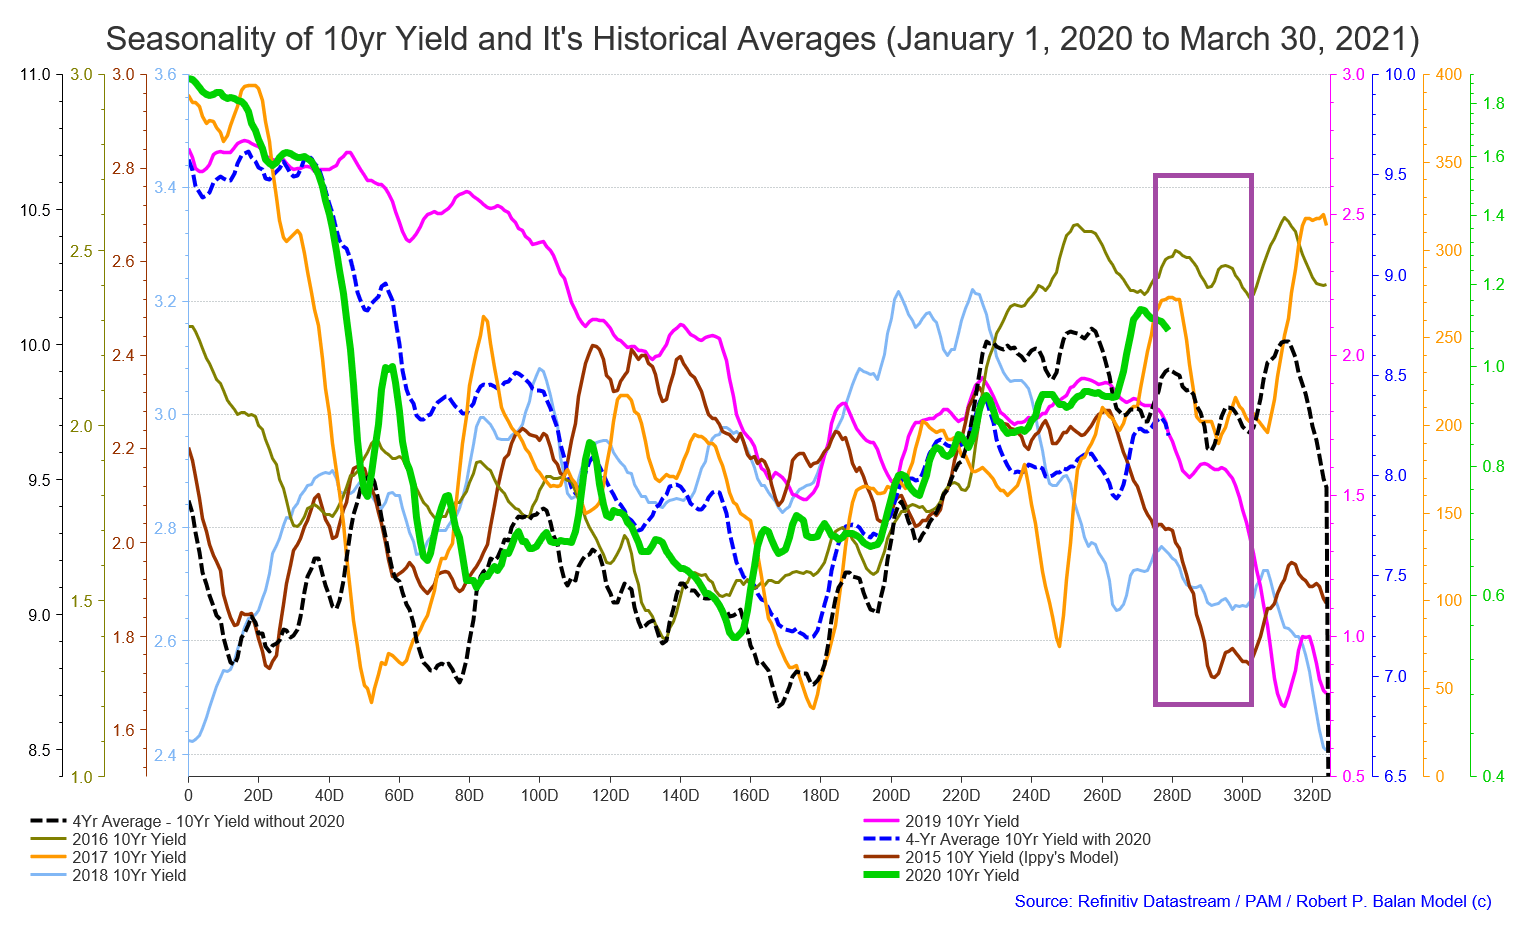 Therefore, what is more significant, I believe, is what yields will do over the next few weeks. If yields are going to roll over big time, as we expect, then equities will be dragged screaming and kicking to the basement as well.But first, we have to see how and when the current yield decline will end. I suspect that will come tomorrow, but Tim and I just hope that yields will fall further enough to deliver some profits to the equity shorts (and TN longs), before yields back up.
I will see you guys/gals in Europe trade.
paradigmJan 26, 2021 4:31 AM
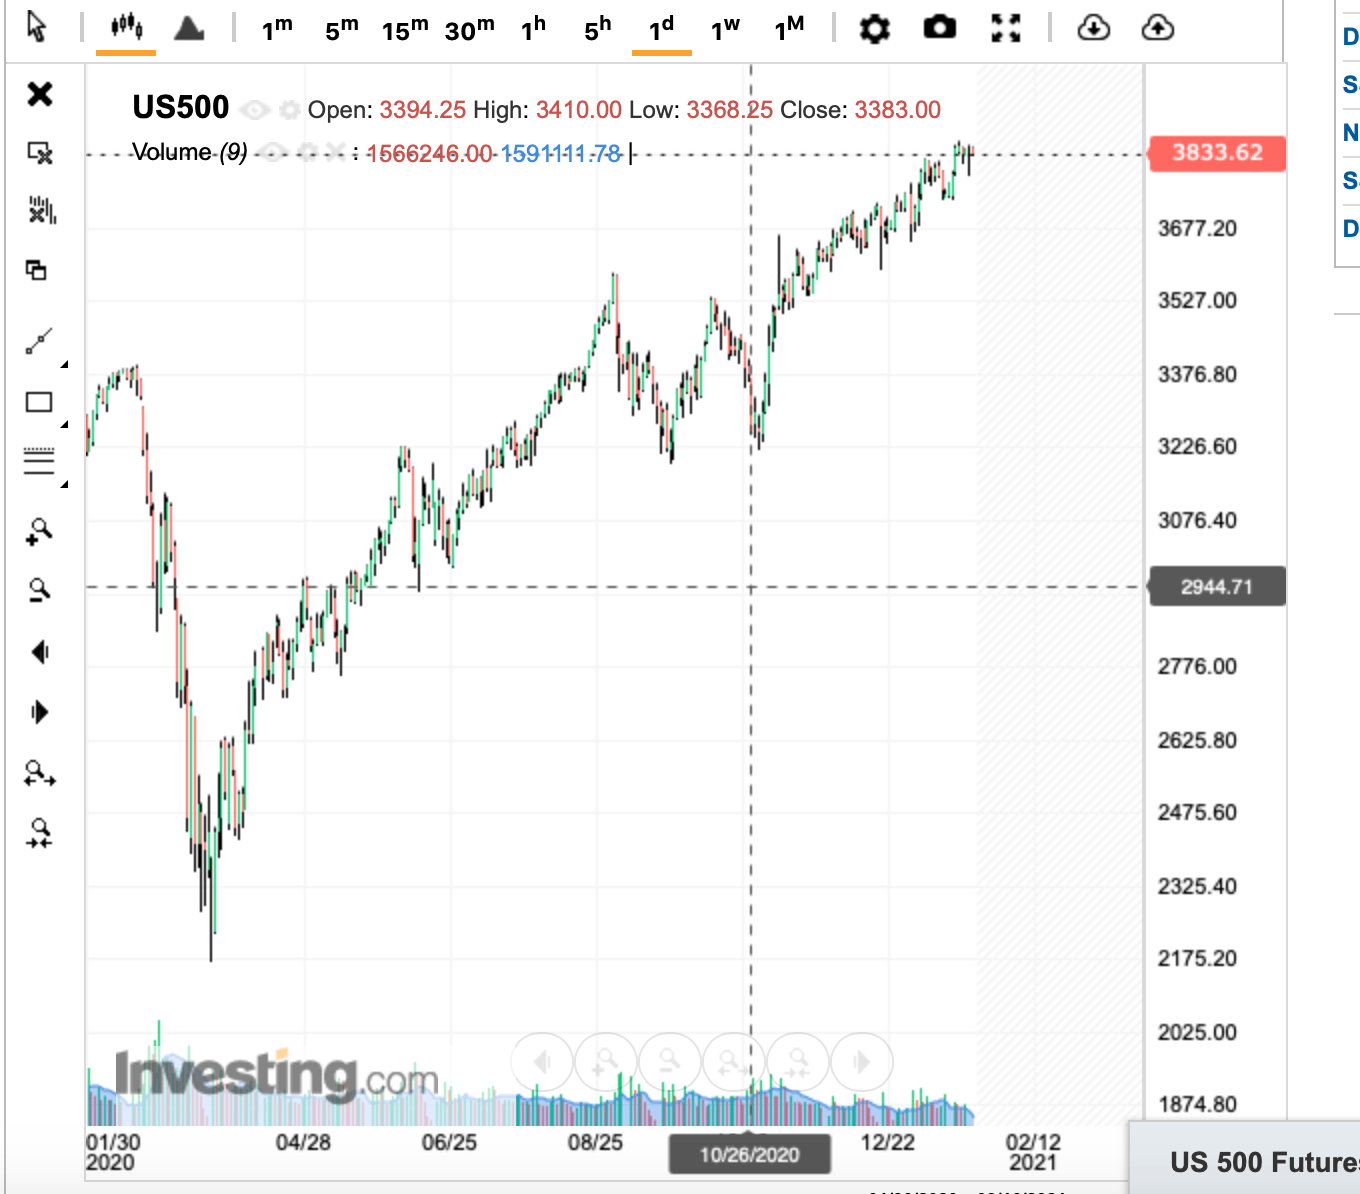
Robert, I am wondering if you have an opinion on the wave degree of the October low in the ES. Do you see that as a wave 2, or a wave 4?
 paradigmJan 26, 2021 4:33 AM
EWT has many different counts, all of which fit within the rules. Do you have a strong opinion? If it was a wave 4, then we are in the last sequence before a big pullback, whereas if it was a wave 2, then there is a long way to go still. (I know the liquidity model is your main focus for trading, so pardon me if the above does not concern you now)
robert.p.balanModeratorLeaderOwnerJan 26, 2021 9:41 AM
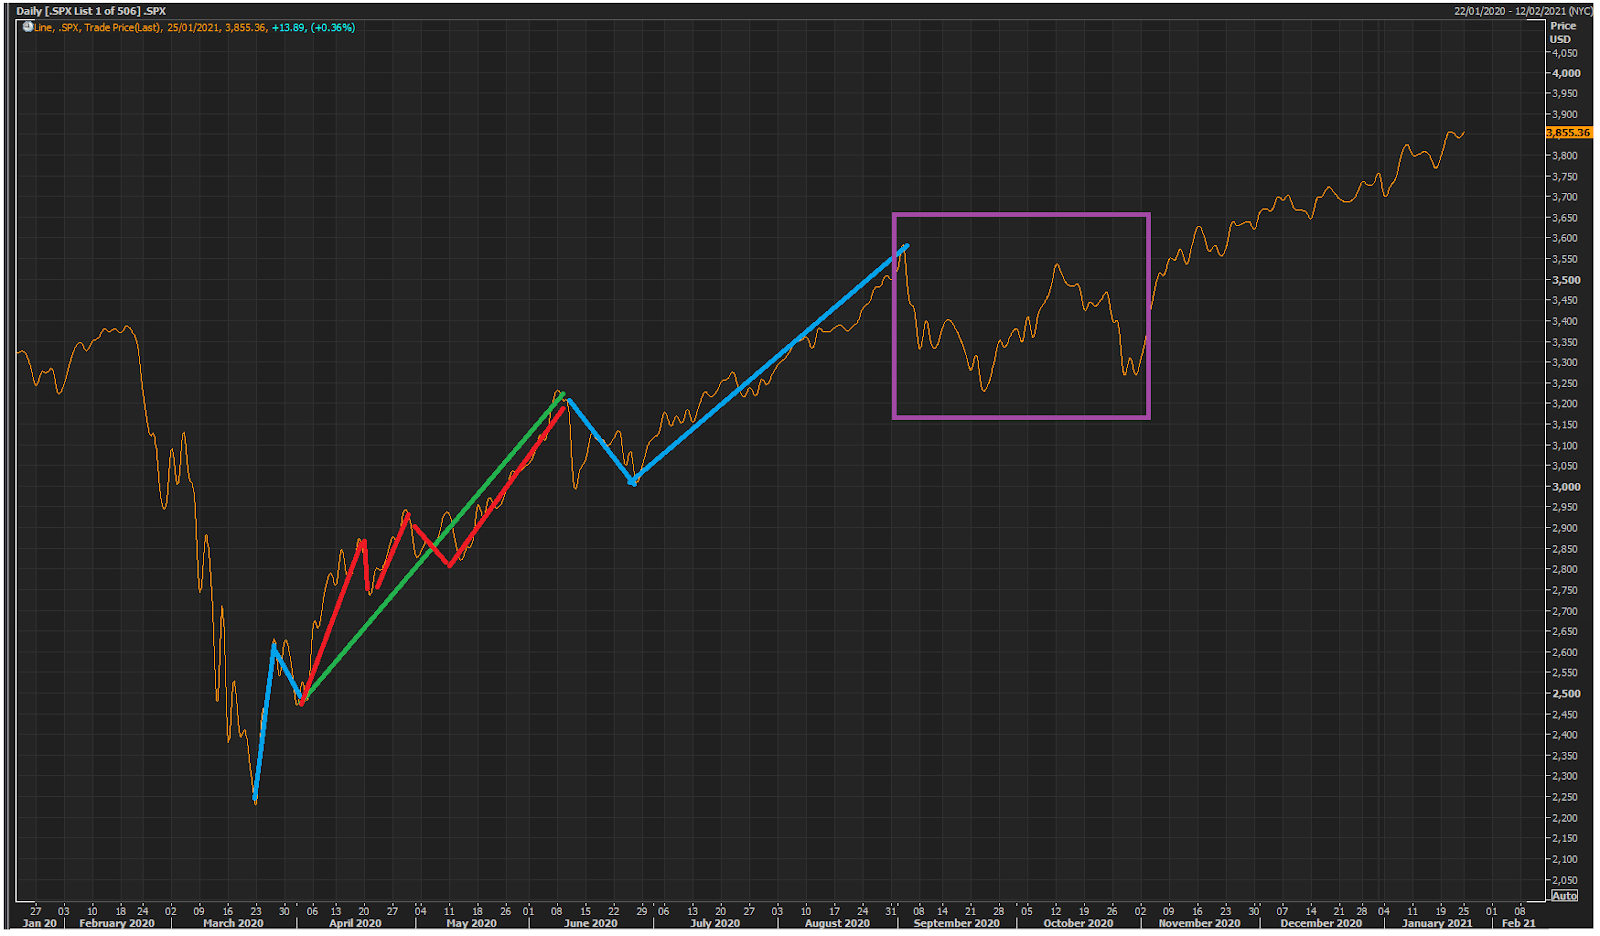
@paradigm -- I have been thinking about the long term wave count a lot. I have been looking at several possibilities. I will show them ranked according to what I think is more likely. These scenarios are all valid, according to EWP, so I am judging these constructs based on their closeness to classic themes.
A large irregular WAVE 2. This construct is closest to ideal wave themes, although that does not make it the "best" -- there are no "bests" in EWP.
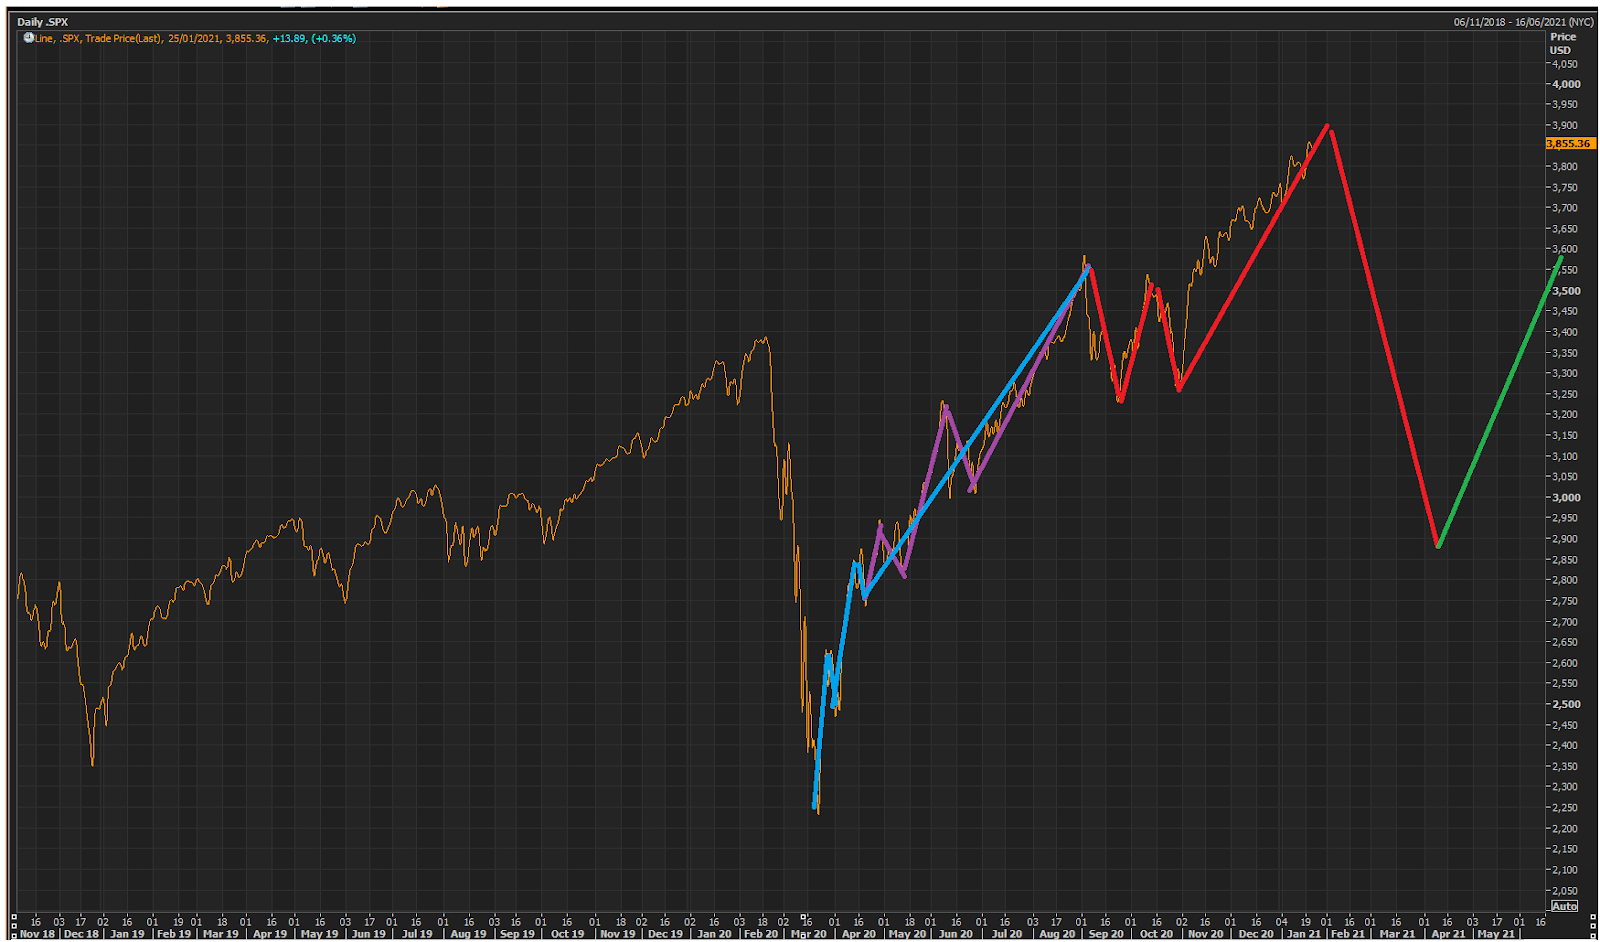 We are completing a five, WAVE 1 -- WAVE 2 retraces 50 pct of the rally from March 2020.
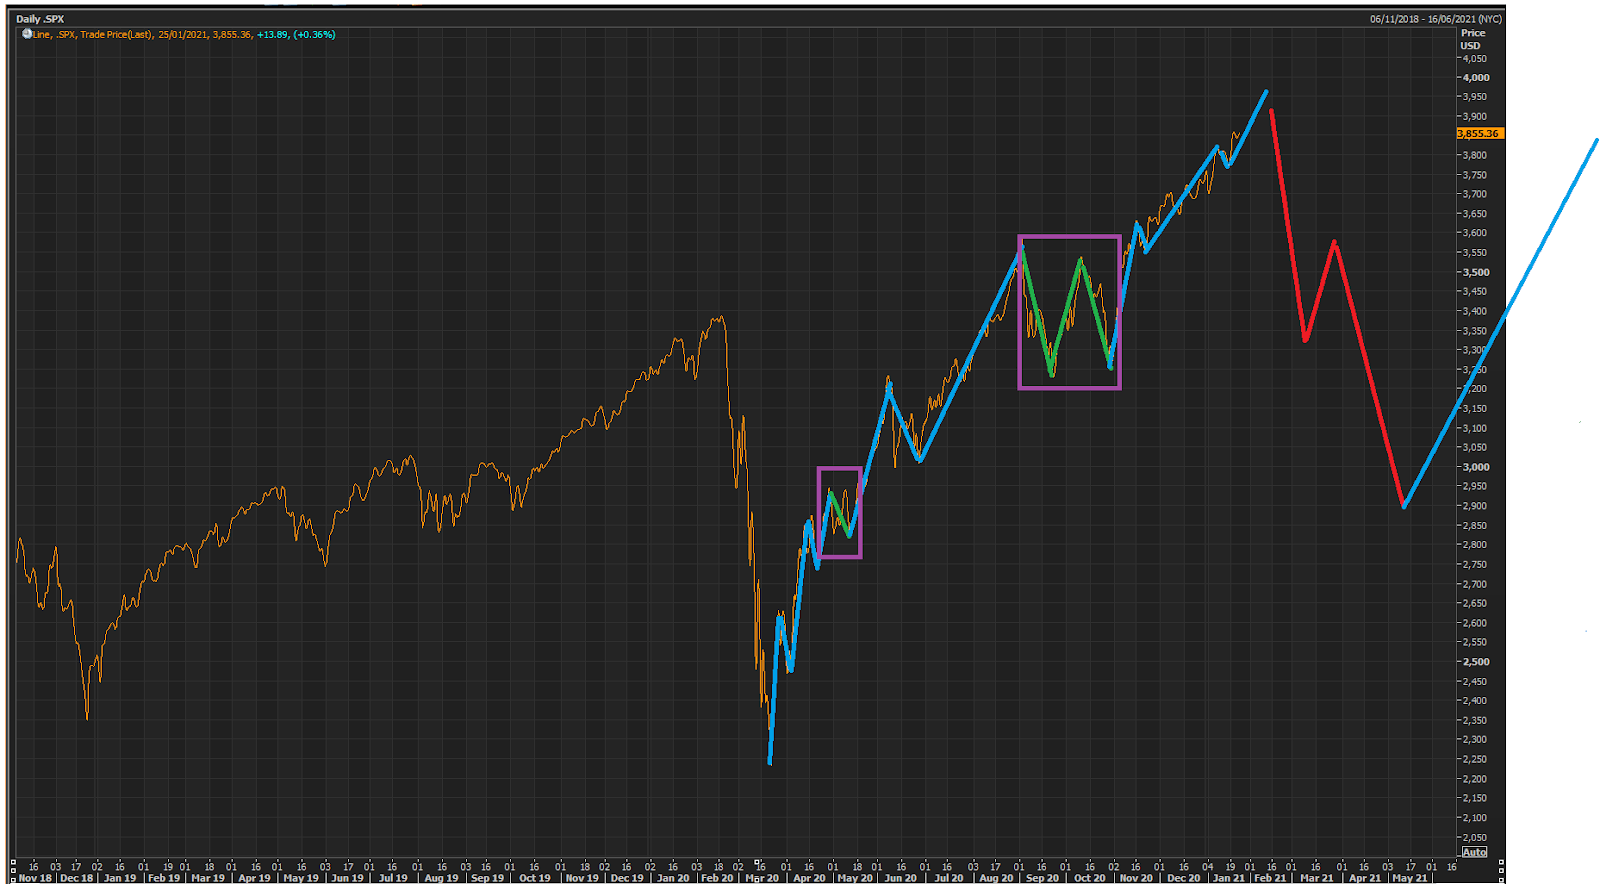 We are completing wave 3 and going into wave 4 of WAVE 1.
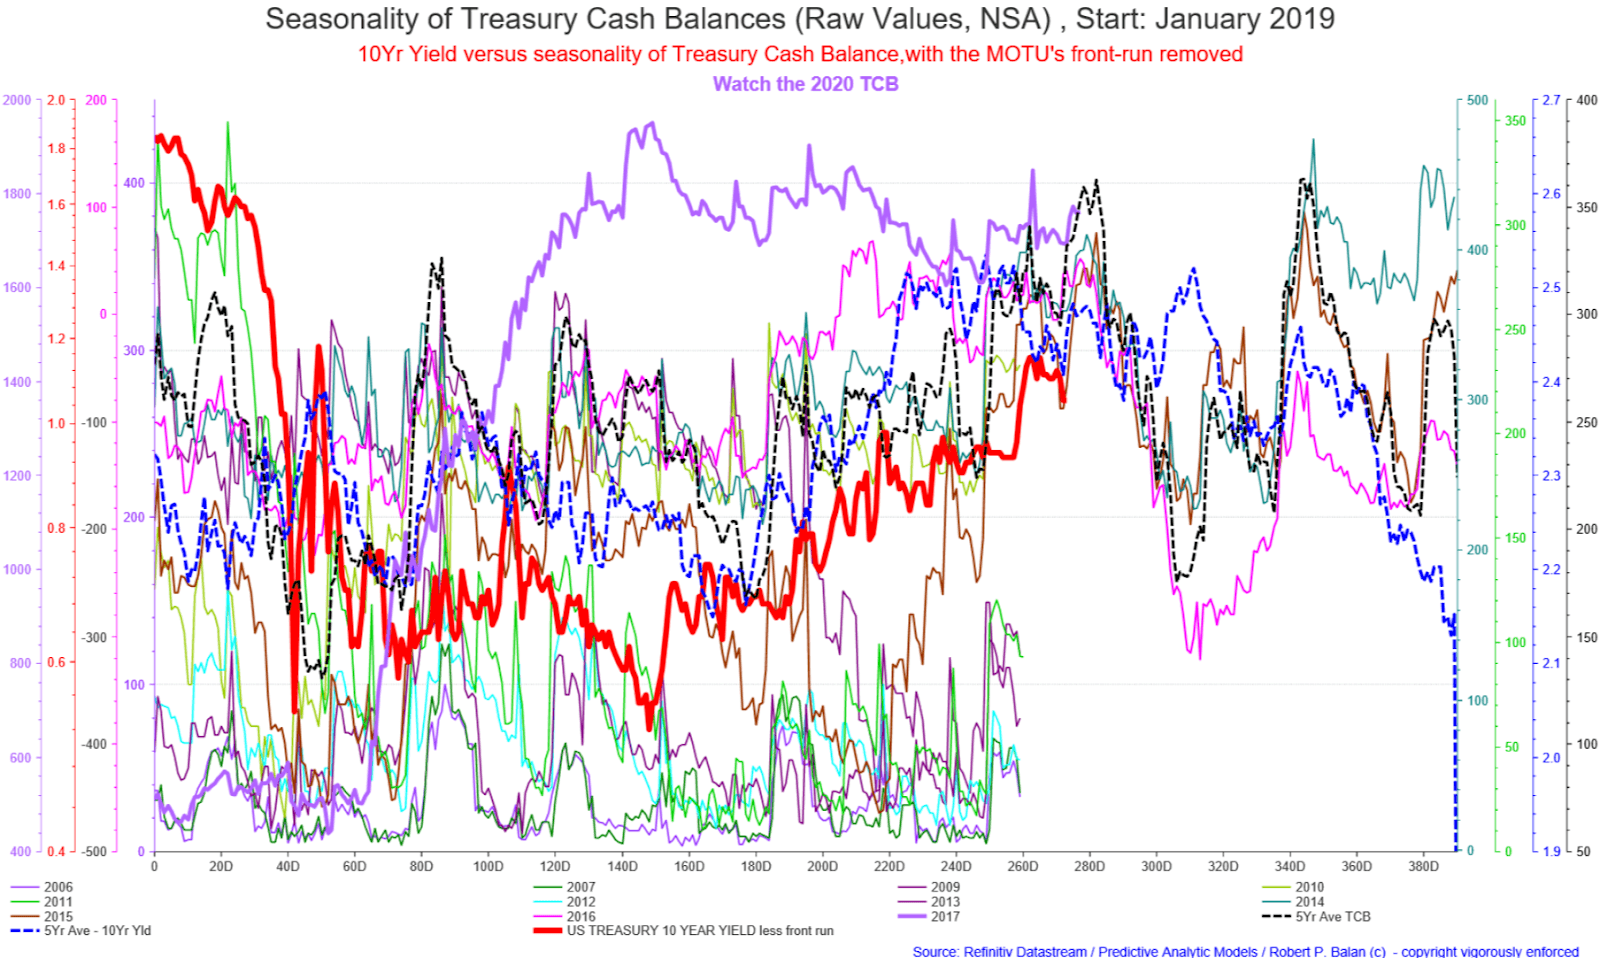
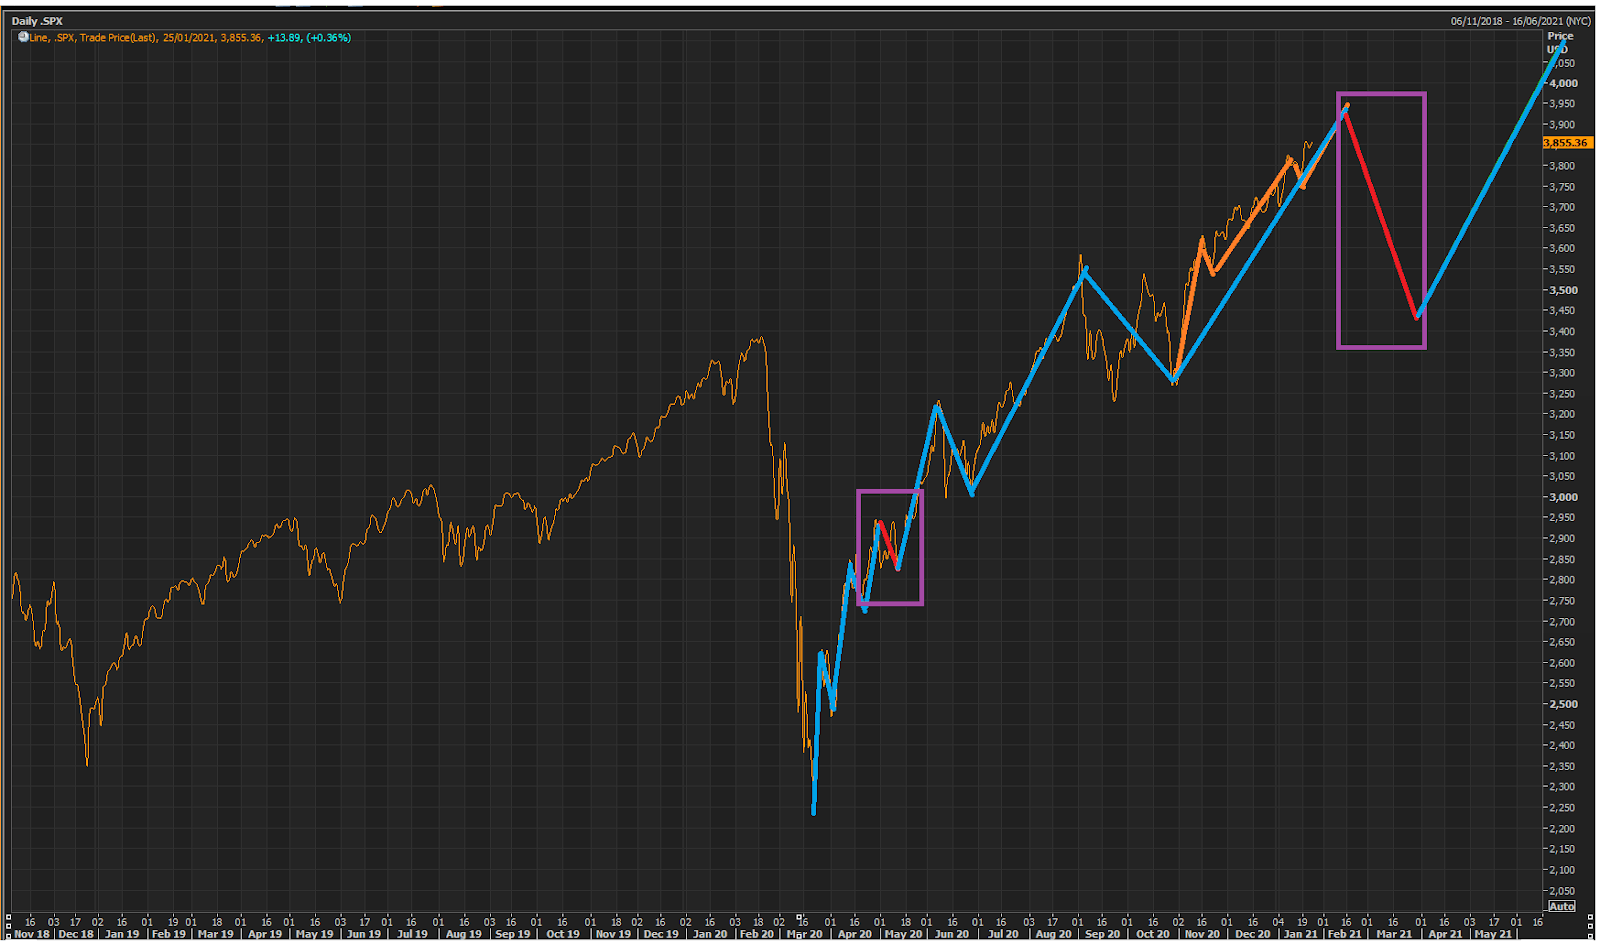 The large irregular (the first one) also makes sense from what the TCB model is showing us.
 robert.p.balanModeratorLeaderOwnerJan 26, 2021 9:53 AM
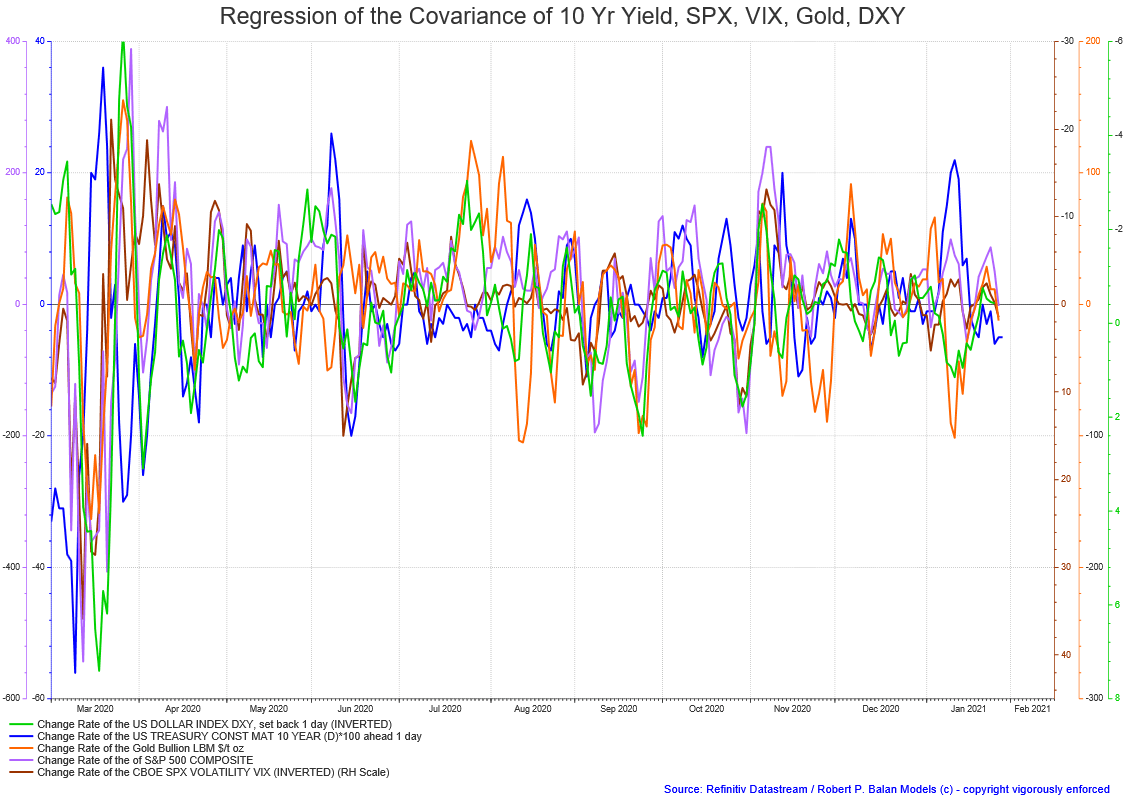
A sharp decline in yields is wthat the tools are telling to be up ahead -- take note that the yield (red line) was set back 7 TDs in the chart above to take out the MOTU's front run.
Whatever EWP form an equity correction will take (if it happens), obviously it will do a great service to the stranded/hedged shorts. Tim and I (the Bossman too) will happily take any of these corrections.
h.jabsJan 26, 2021 10:22 AM
hi robert, thanks for the analysis. one question, will you be setting up a core short position and scalp around it on the down move, or will you just keep scalping around the move. tia.
vjapnJan 26, 2021 10:34 AM
Robert, Yields made a lower low and have rallied since. Is the short term down move in yields over?
robert.p.balanModeratorLeaderOwnerJan 26, 2021 10:46 AM
h.jabs -- We will be doing both Mr. Jabs -- a core short (to lessen the price travel in mitigating the stranded shorts). and we will be doing scalps as well, coming and going.
vjapn looking at it, but maybe not yet the bottom of yield decline.
h.jabsJan 26, 2021 11:04 AM
many thanks RB.
paradigmJan 26, 2021 10:54 AM
Thanks for outlining the possibilities Robert. There are two people whose wave counts I pay attention to because their work has some rigor to it. One of them views the October low as the bottom of wave 2 and we are now going to the moon. It is this interpretation that concerns me. I see that it is not one of your listed interpretations. Glad to see that. (though I know that anything can happen)
robert.p.balanModeratorLeaderOwnerJan 26, 2021 11:03 AM
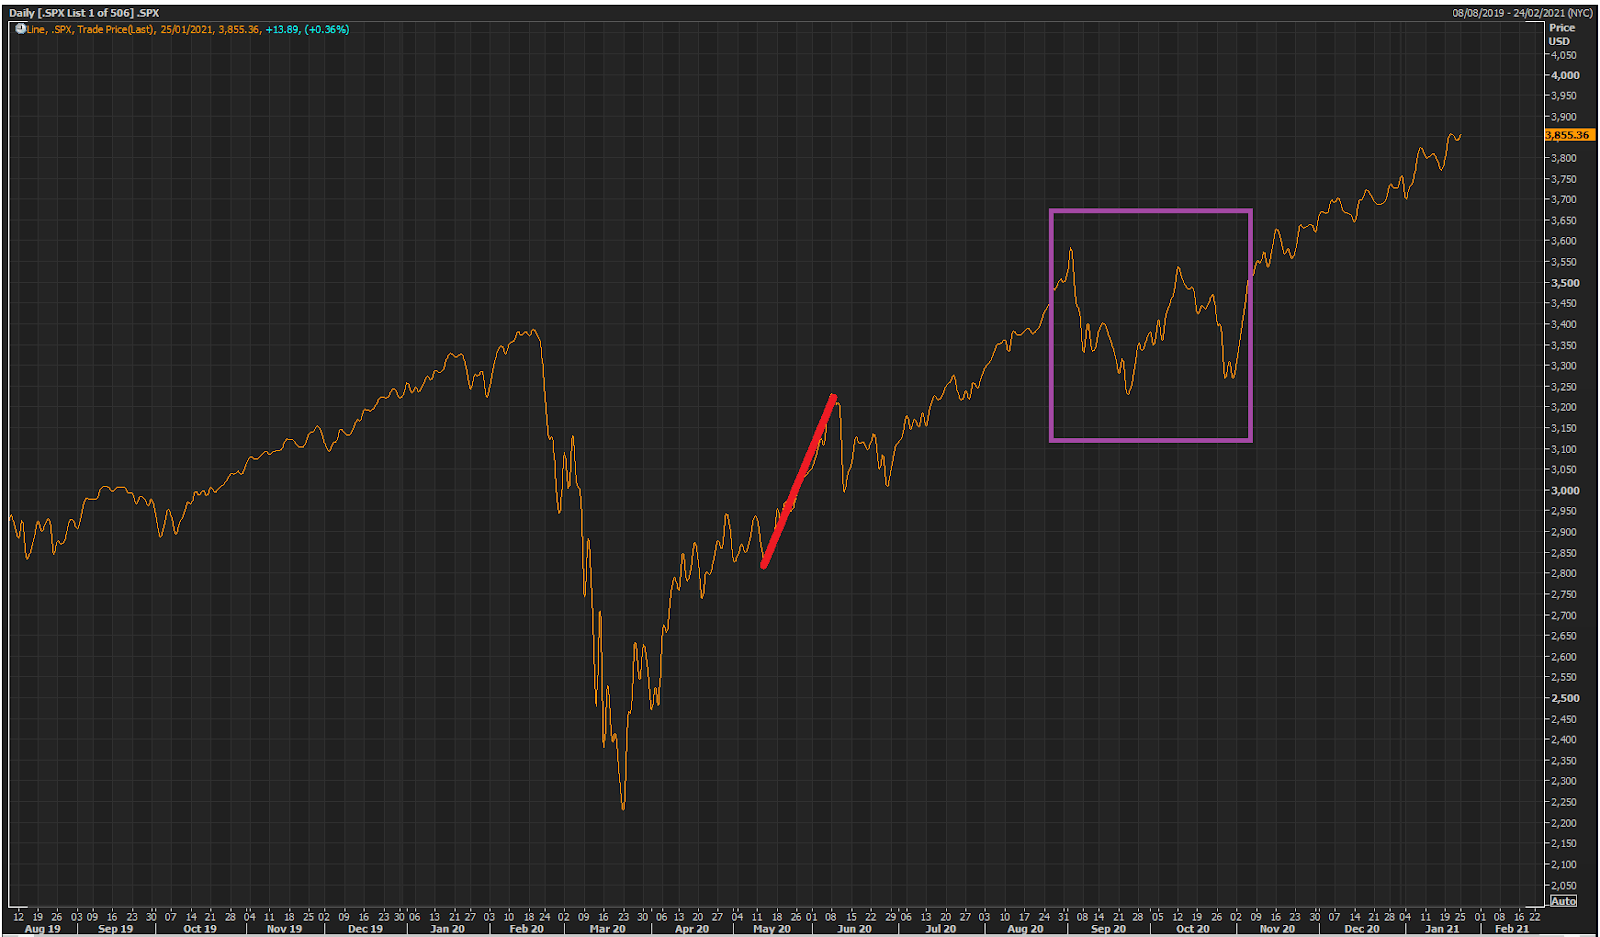
paradigm --- that seems the obvious one. But any scenario which counts the Oct low as terminus of Wave 2 runs into trouble with the short "wave 3" (red line). Any count which considers this as third wave runs into trouble -- from EWP rules. That red line will always be the shortest in any scenario which takes that purple box as wave 2.
paradigmJan 26, 2021 11:17 AM
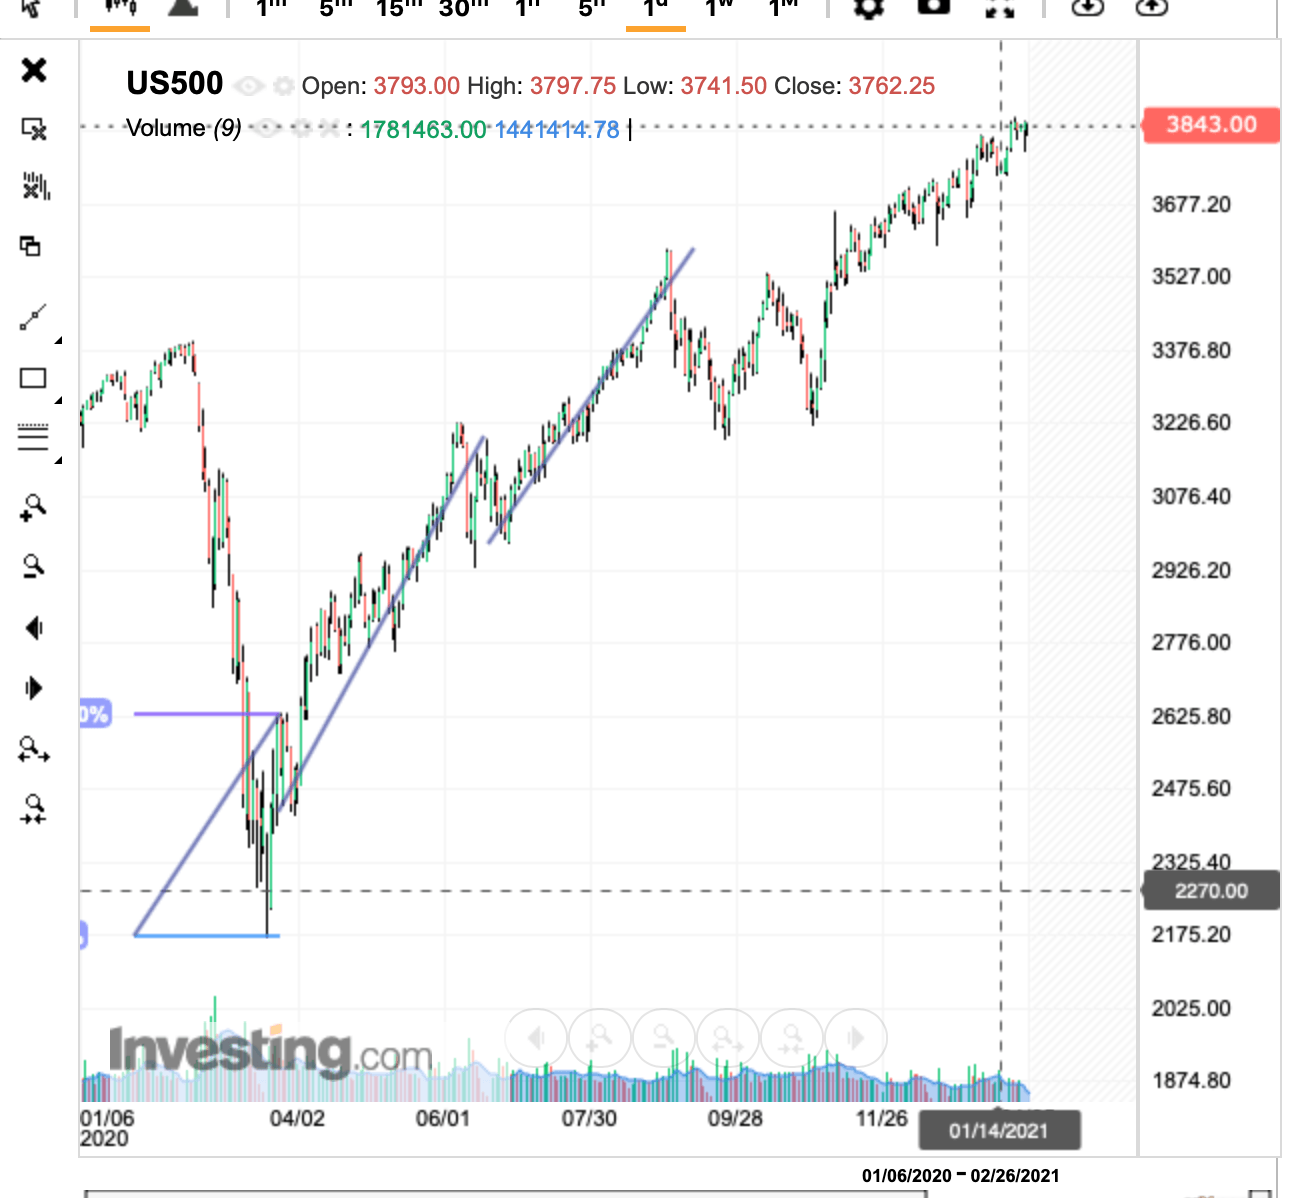
I see what you are saying. However he counts the third wave from the bottom struck in late March, and that gives a third wave that is the longest.
 robert.p.balanModeratorLeaderOwnerJan 26, 2021 11:20 AM
That's very wrong from the get-go -- wave 2' cannot be lower than wave 1. He is making his own rules -- this one of the only three rules in EWP that are inviolate. Otherwise, you can conjure any wave count you can imagine.
paradigmJan 26, 2021 11:22 AM
wave 2 is not lower than wave 1. The pullback March 31/April 1 was higher than the March bottom.
 robert.p.balanModeratorLeaderOwnerJan 26, 2021 11:30 AM
So the green line (with internal red lines) is wave 3. If it is, I still have plenty of issues with that.
But, OK, different EWP folks, different strokes. Let's see how that pans out.
paradigmJan 26, 2021 11:40 AM
Yes, the green line is wave 3. The whole structure looks like it is a diagonal with 3 sets of abc waves. However the waves do not overlap, unlike most diagonals. It obeys all the rules. Obviously, I hope that this is not the correct count and that we get a decent pullback to take stranded shorts out of purgatory. Thanks for going over this diagnosis.
robert.p.balanModeratorLeaderOwnerJan 26, 2021 11:57 AM
If you use daily close points, the entire structure becomes very clear. Diagonals are at fifth waves/wave 5s. But I do not see how that diagonal is drawn so I can't comment with certainty. Diagonals are never wave 3s.
john.derJan 26, 2021 12:16 PM
fwiw - the best other ewp theorist I follow has us currently in a wave (II)[current correction] of iii of 5. And, this is a Wave I from March. So, if that is true, we move into a wave (III) of iii next, the 2x wave 4 and wave 5's followed by a deep correction.
ilittletiger101Jan 26, 2021 2:52 PM
that is the problem of EWP. every greatest expert can come up different waves....
robert.p.balanJan 26, 2021 3:19 PM
. . . and all of them can be, and are probably, wrong.
robert.p.balanModeratorLeaderOwnerJan 26, 2021 3:32 PM
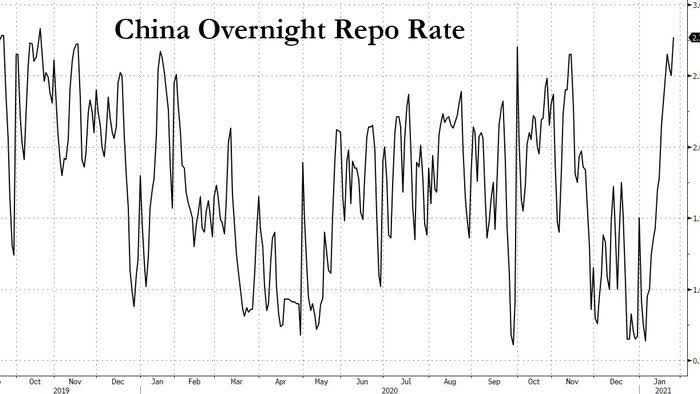
China Repo Rates Soar To 15 Month High After PBOC Warns Of Asset Bubbles, Drains Liquidity
*That signals the end of the crypto bull rally, for now. Liquidity from China is what is powering cryptos. *
Where else in the world do you go? Where do you put that money? For the global asset allocators who stay in equity, I don’t think you necessarily rush back to the dollar and you definitely are not touching Europe”.
robert.p.balanModeratorLeaderOwnerJan 26, 2021 3:51 PM
Just checked with the Bossman if it is OK to show this, and he said only for PAM members. Can't put this in the blog.
(Sorry, chart is for PAM members only).
plavacJan 26, 2021 4:14 PM
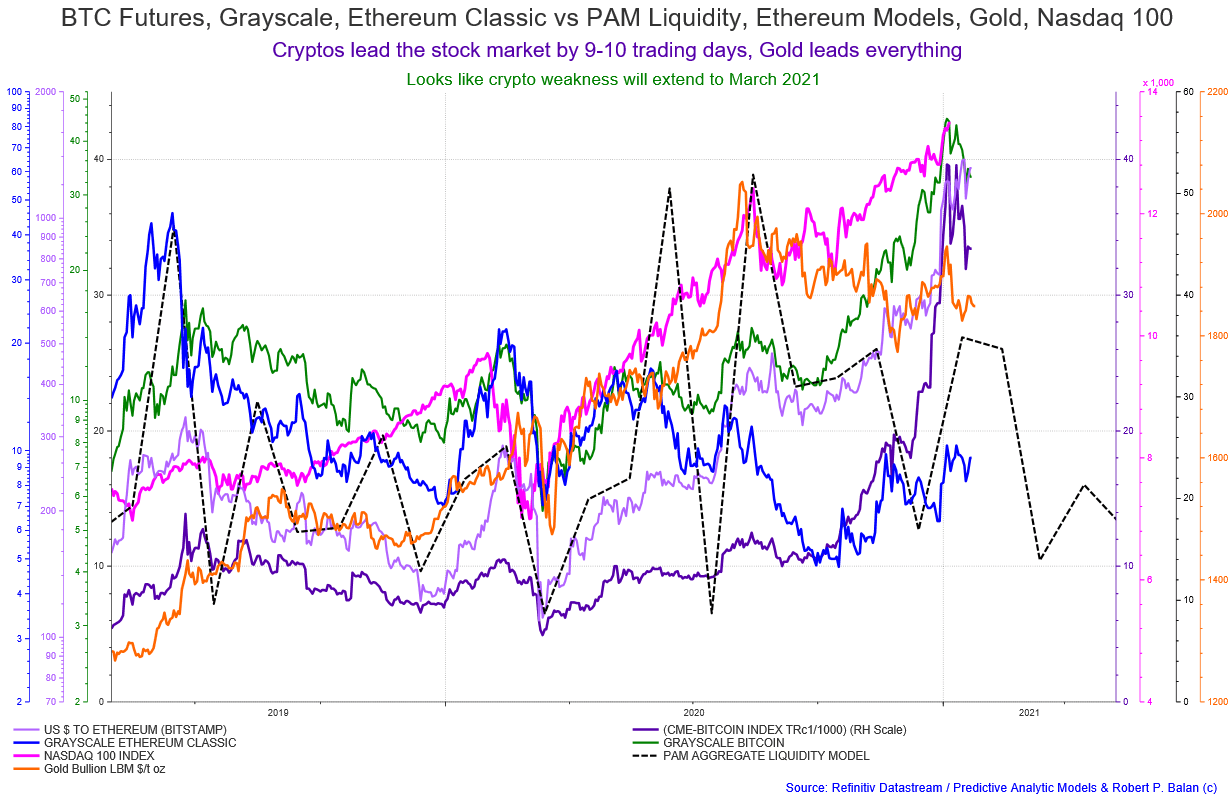
Which assets will be affected by a possible fall in cryptocurrencies, gold or stocks
robert.p.balanModeratorLeaderOwnerJan 26, 2021 4:35 PM
plavac All of the below
 plavacJan 26, 2021 4:58 PM
It is big consequences, thank you Robert
bogeygolfJan 26, 2021 8:21 PM
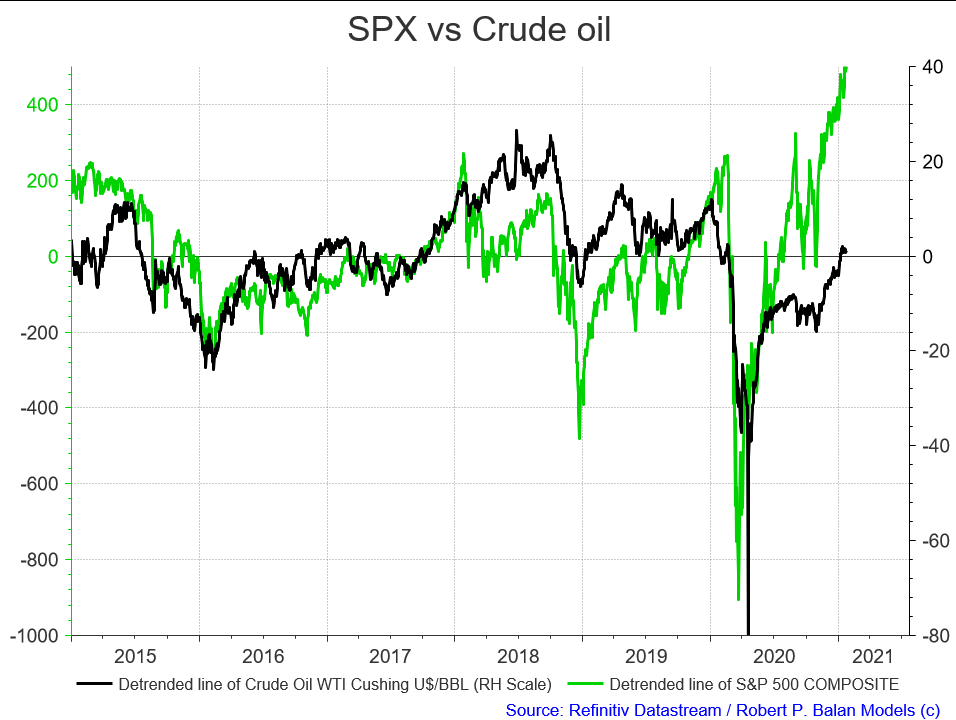
RB, use short oil as a hedge for long equities in final week of Feb run to top ?
robert.p.balanModeratorLeaderOwnerJan 26, 2021 8:31 PM
The positive covariance between SPX and Crude oil is significant, so I don't know if that should concern you.
 john.derJan 26, 2021 9:24 PM
ZZZZZZZ
flamarkJan 26, 2021 9:28 PM
ZZZZ- is better then Ouch! (XBI)
nichaJan 26, 2021 9:29 PM
I just can't believe the squeeze in GME. That's freaking unbelievable.
It's not just wallstreetbets retail.
https://twitter.com/spotgamma/status/1354045040365068289
robert.p.balanModeratorLeaderOwnerJan 26, 2021 10:23 PM
I will see you guys/gals in Asia. GN everyone.
JANUARY 27, 2021
GOOD MORNING ASIA / GOOD EVENING WEST COAST
robert.p.balanModeratorLeaderOwnerJan 27, 2021 6:08 AM
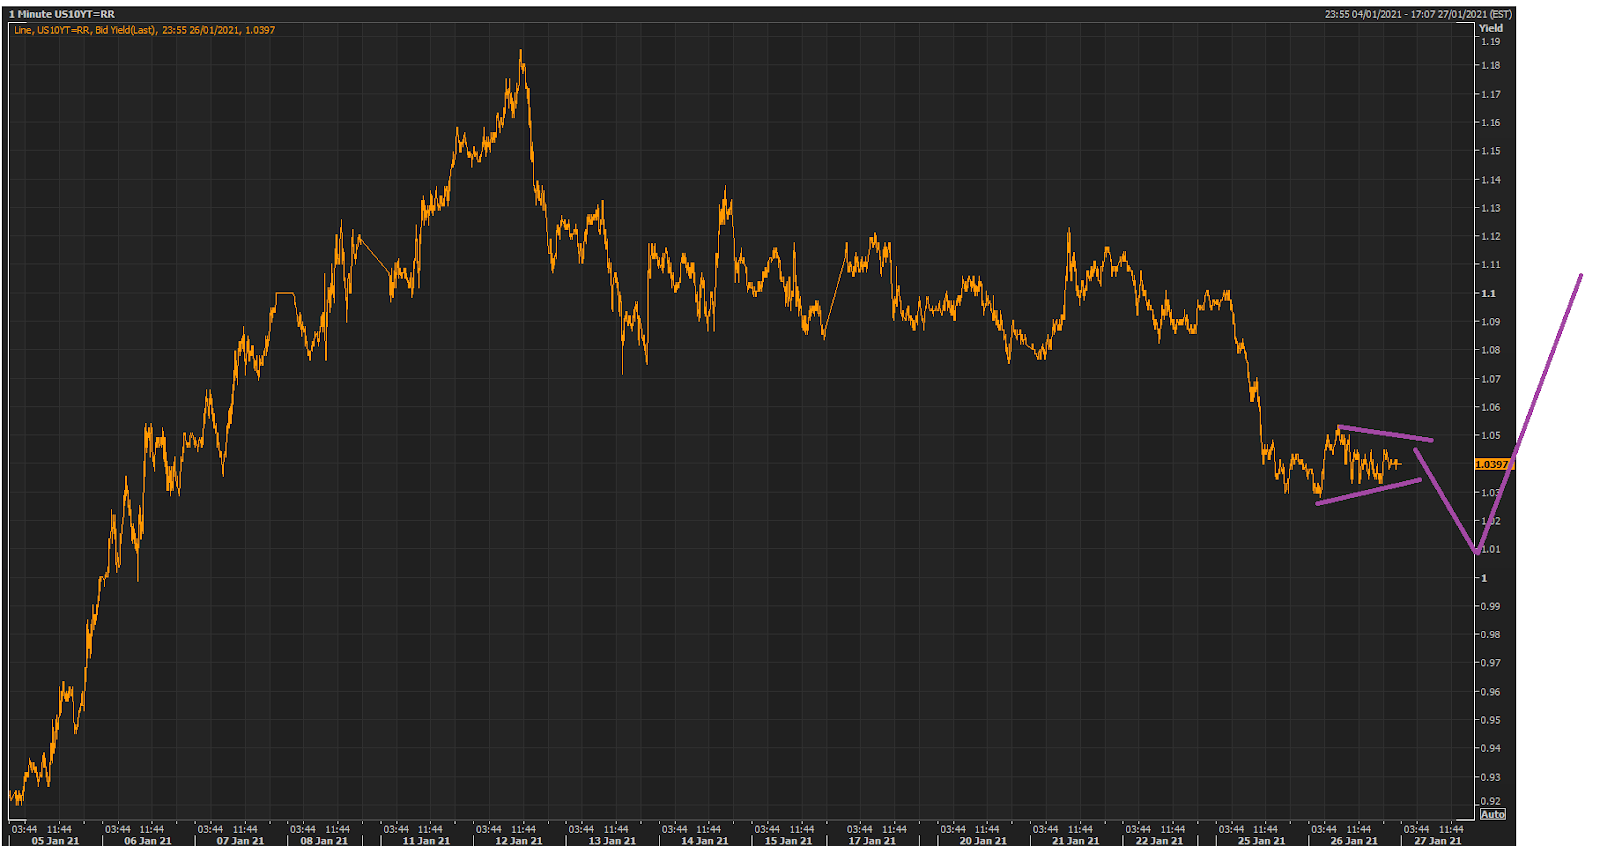 We may yet get that last dip in yields later today.
I hope that gives a last uptick which enables us to exit from long TN scalpers . . .
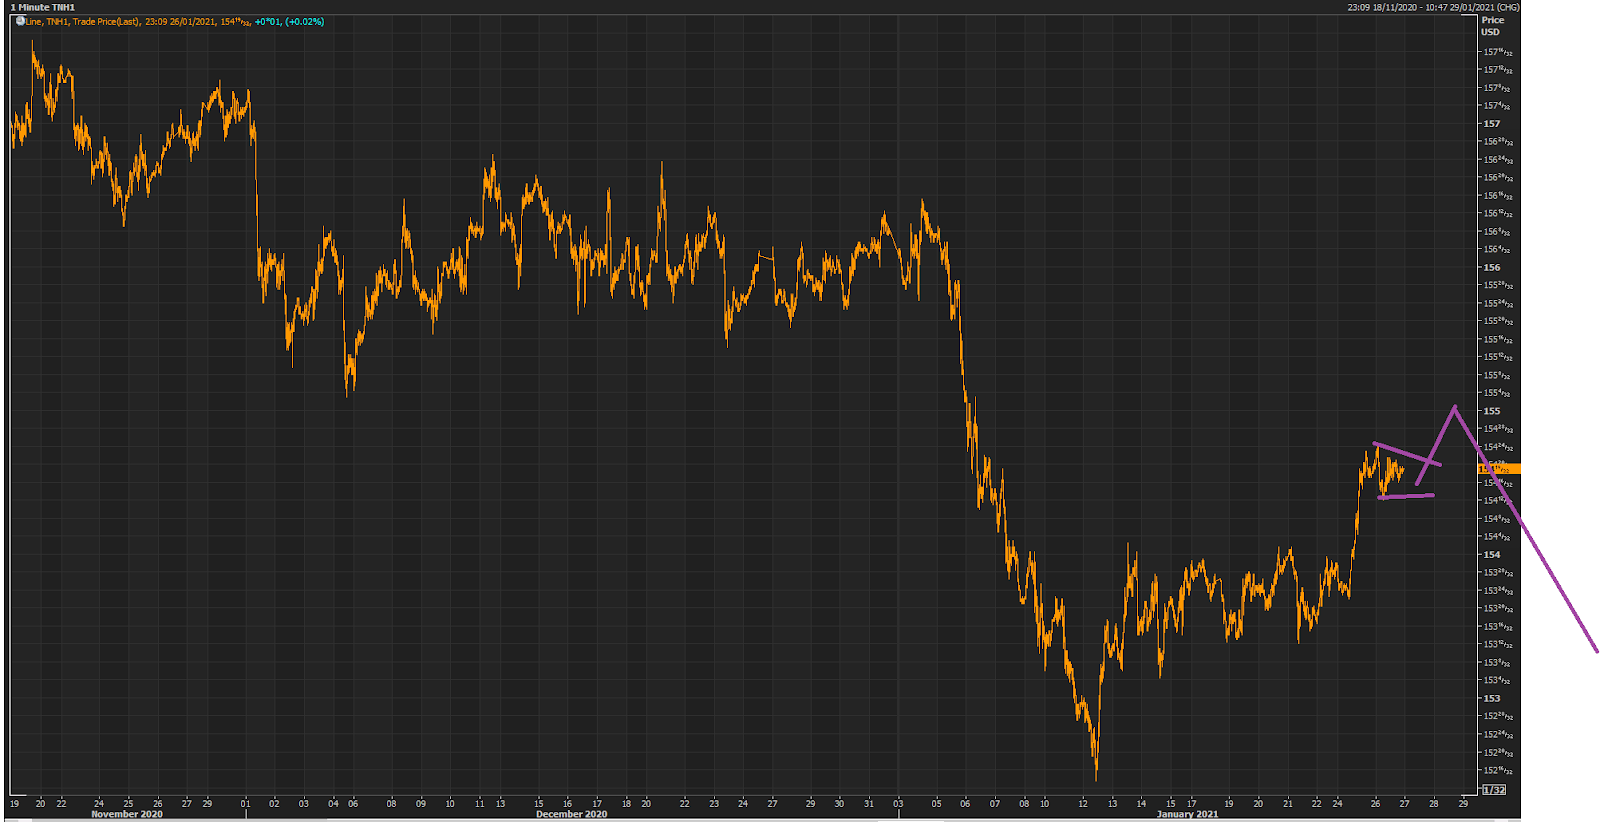 and short equities.
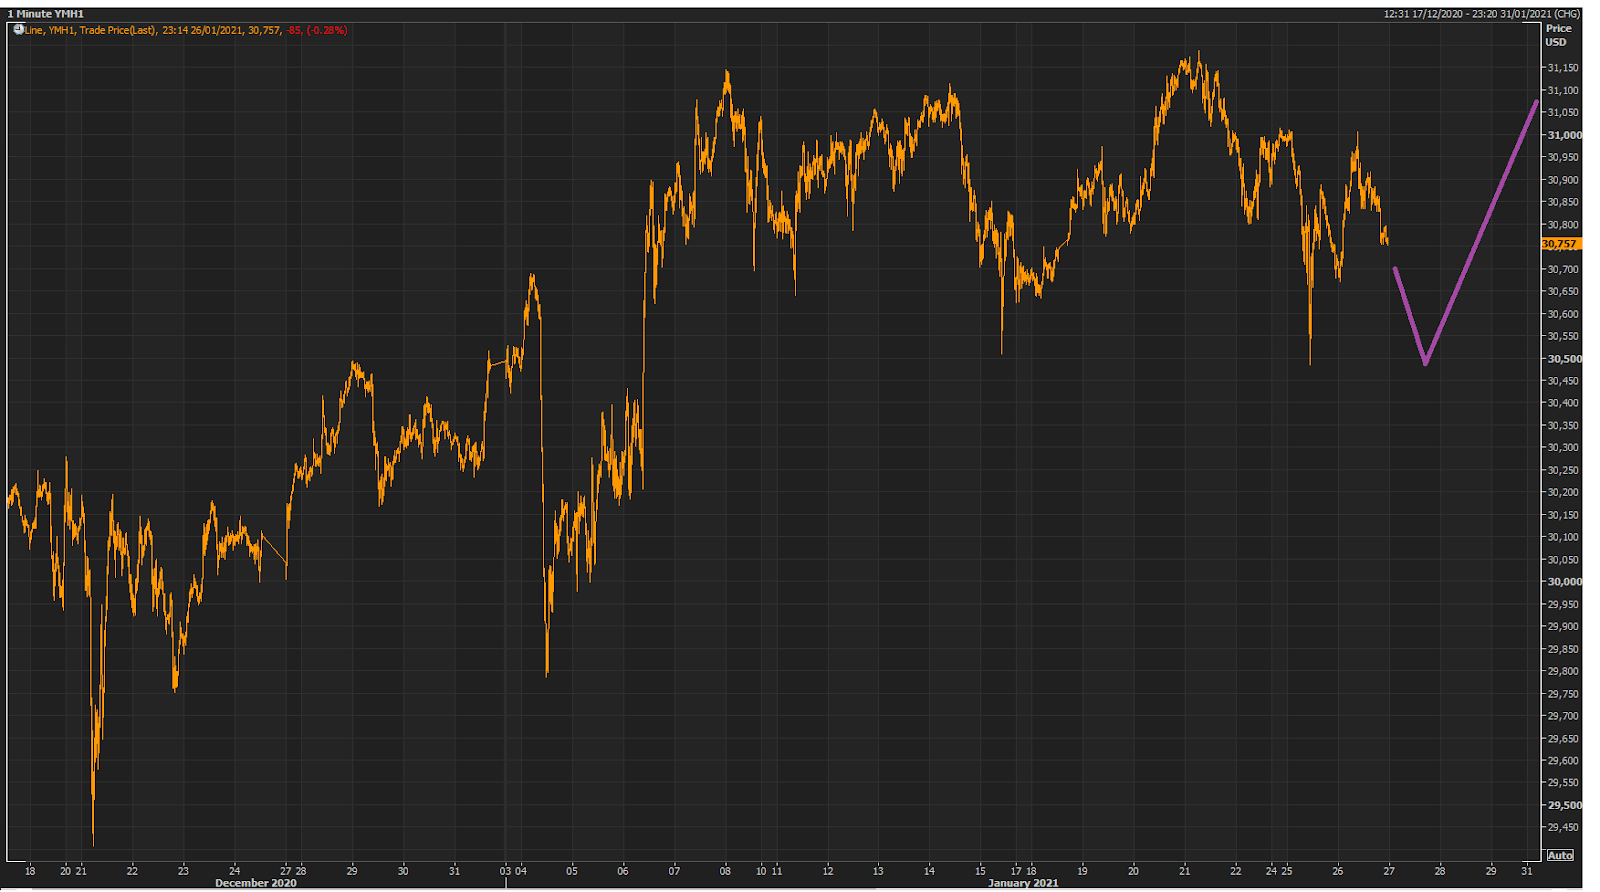
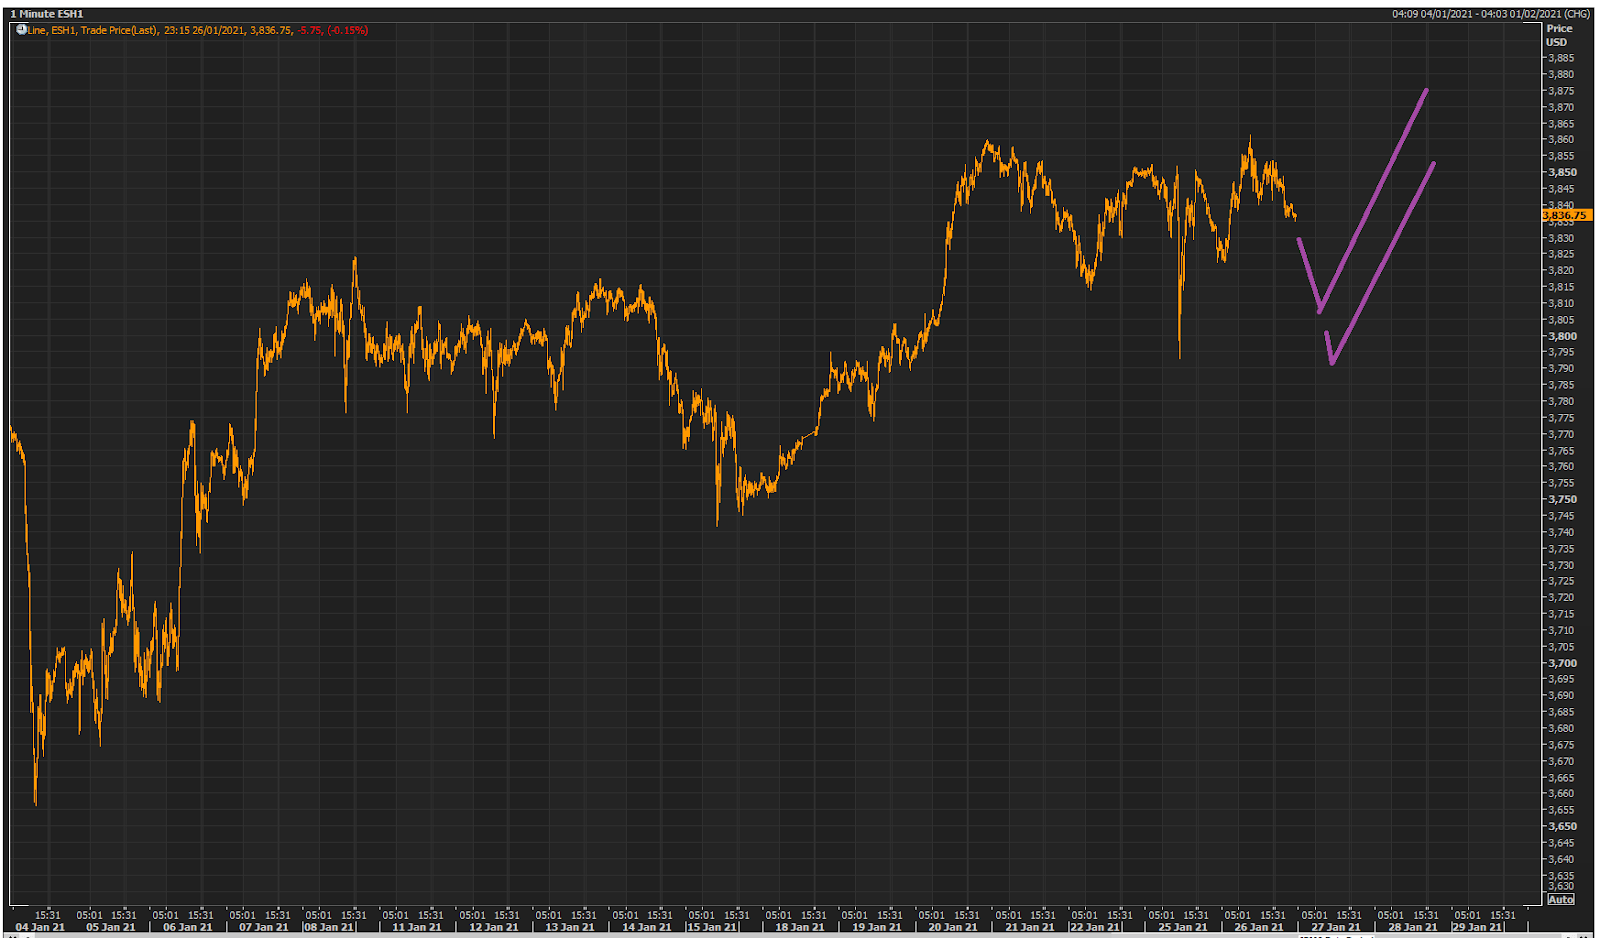
Slim pickings remaining on the downside -- but we will take what is offered (if offered).
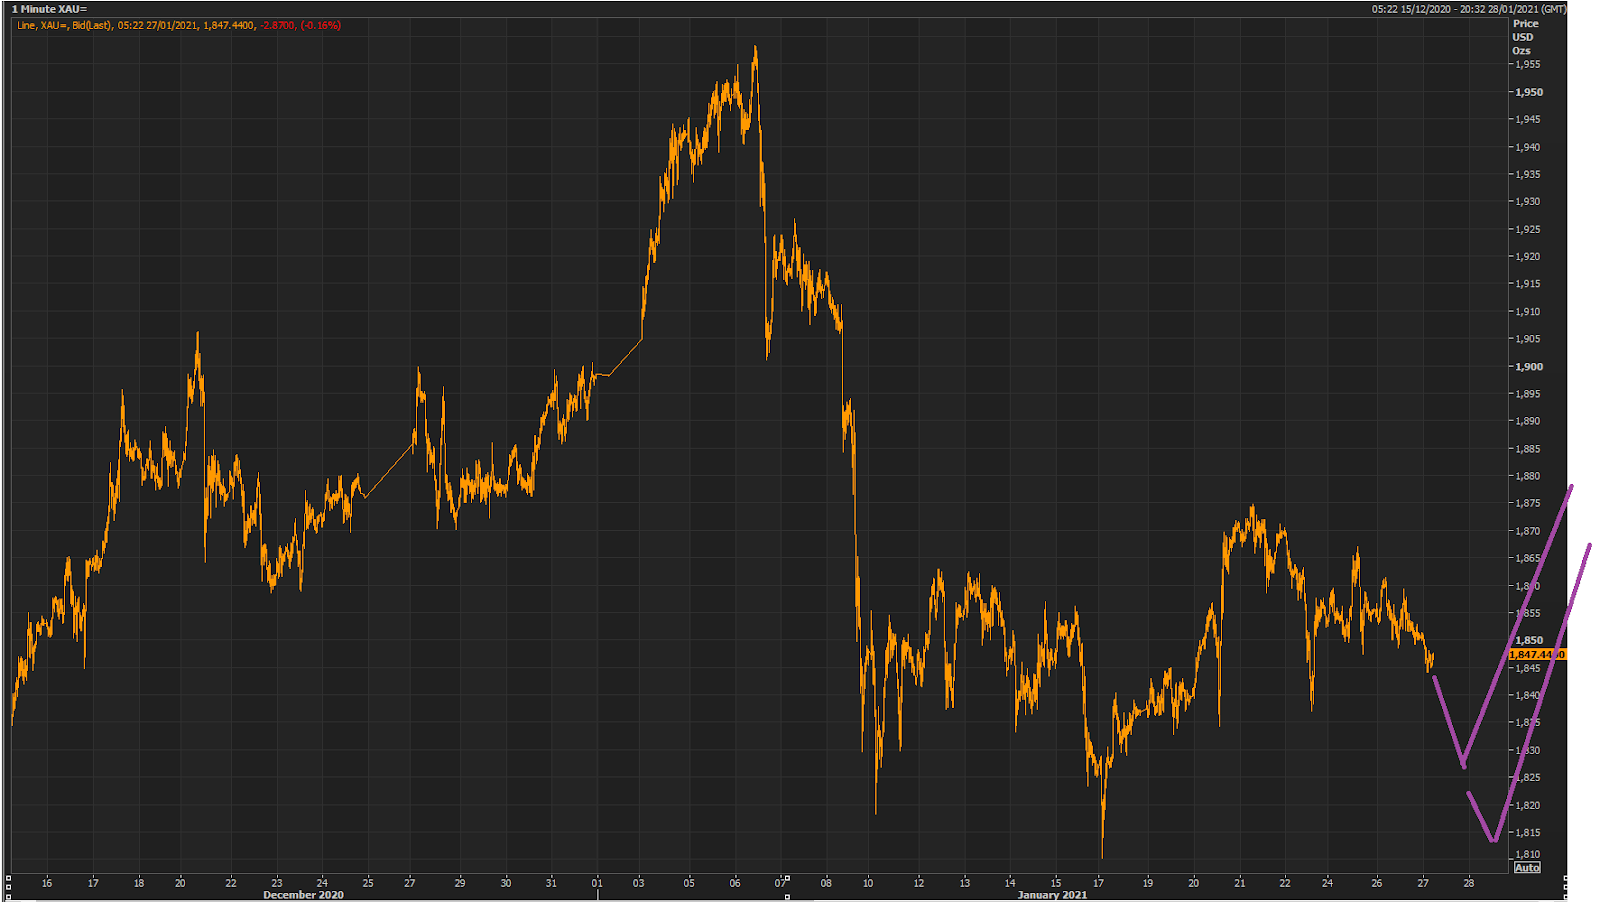
Mr. TK was telling me that we have again a positive covariance between equities and Gold. So if we get to see one last dip in equities, then that may be true for gold as well.
 I hope that provides enough downside for us to exit the short gold hedge.
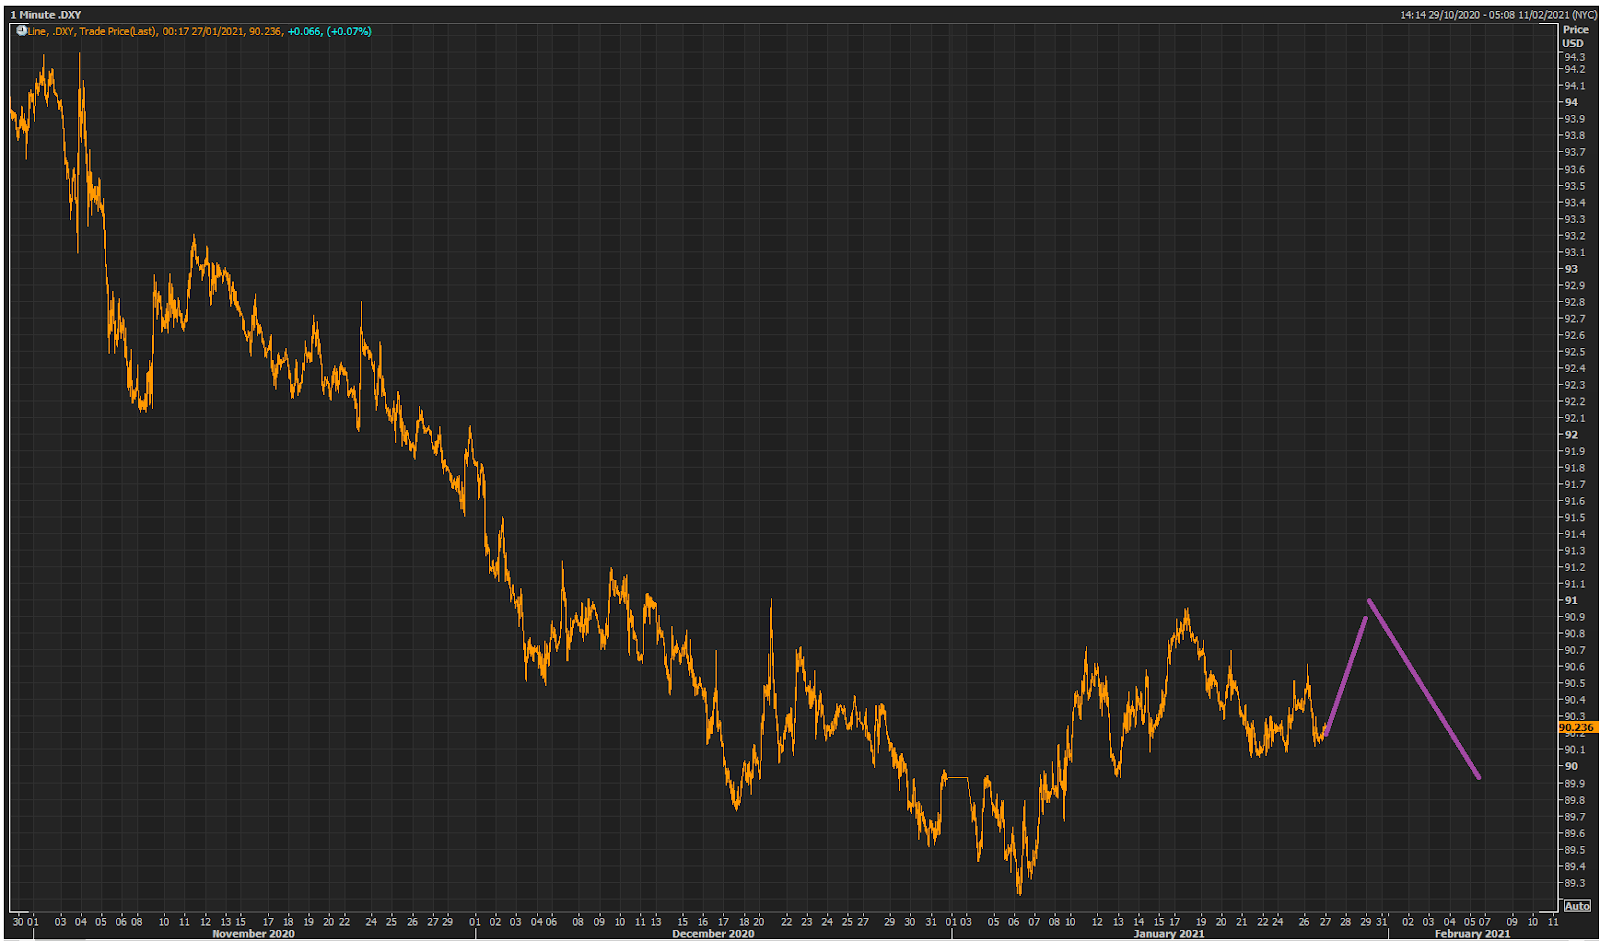
 And basing action in DXY may continue.
 flamarkJan 27, 2021 1:22 AM
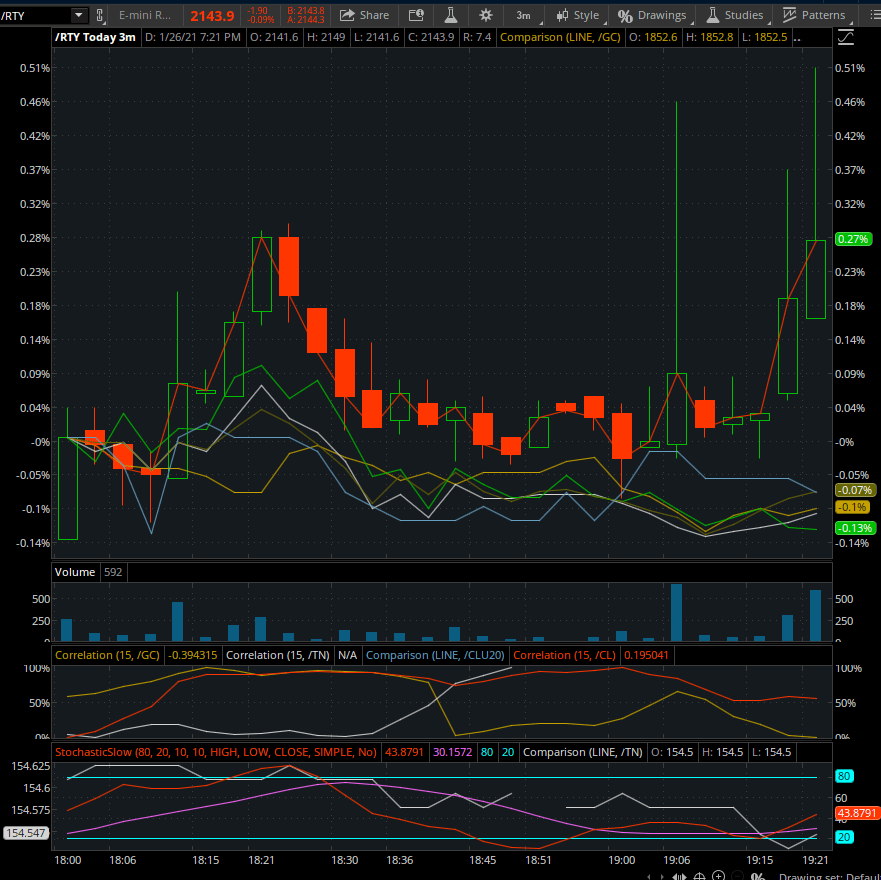
What is going on with RTY??
 robert.p.balanModeratorLeaderJan 27, 2021 5:51 AM
flamark The 2019 Treasury Balance Model's positive covariance with the XBI change rate is the thing to watch.
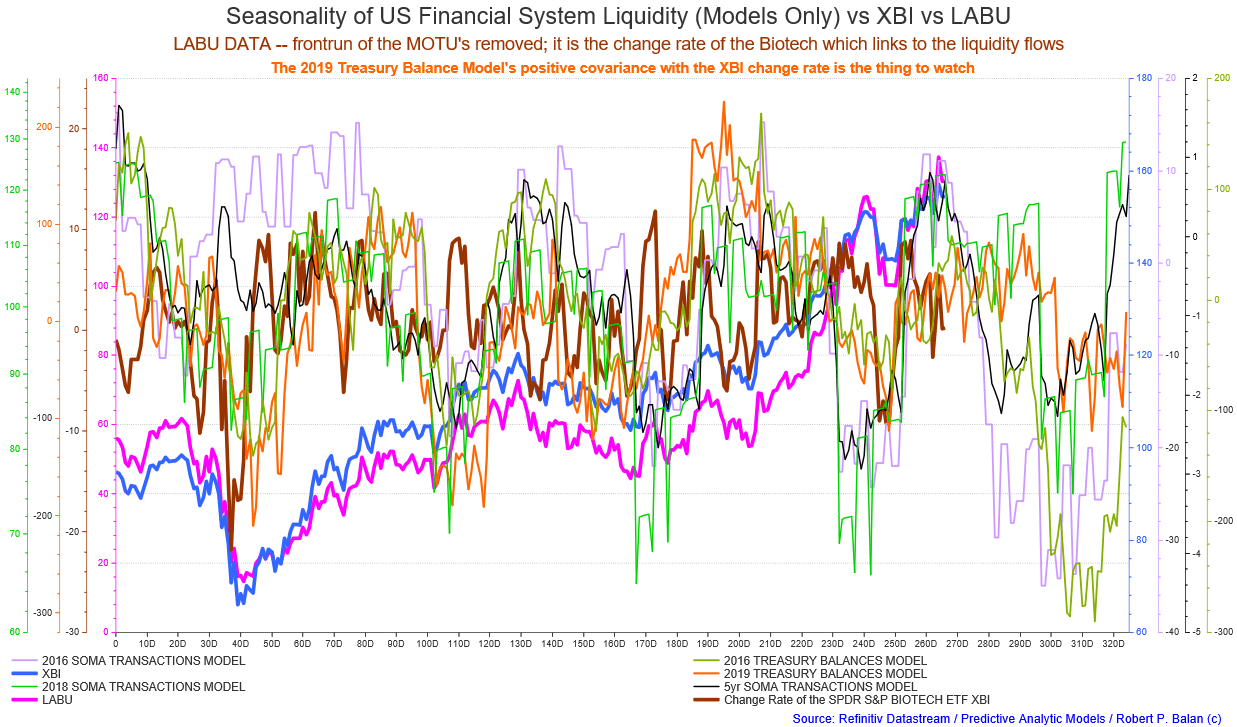 The XBI is showing topping action, but the interesting feature in the chart is the positive covariance between the TCB and XBI.
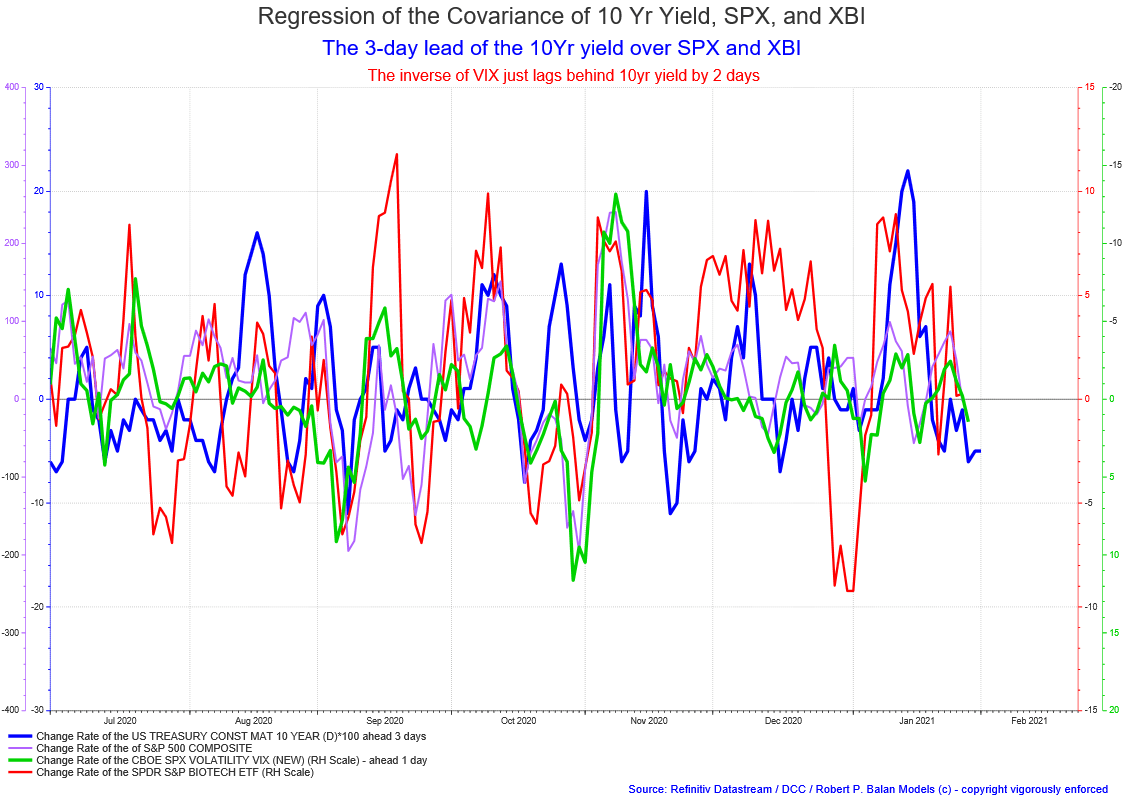 robert.p.balanModeratorLeaderJan 27, 2021 6:41 AM
On NY close basis, the 10yr yield has been leading SPX, XBI, inverse of VIX for two to three days.
surfinusaJan 27, 2021 6:56 AM
robert.p.balan Thank you for the chart depicting the positive covariance of 2019 TCB vs. XBI. From TD40 onwards XBI direction seems to be in sync with the 2019TCB.
2019TCB peaked around TD195 and trended down (for a large swing) for 50 days from TD195 to TD244. However, XBI kept climbing up (to a possible peak on TD265. Should we interpret the chart as follows: 'If the covariance holds, XBI should turn down for (at least) a modest swing lower to match the TCB downtrend (of 50 days). And are we saying that there is a 70 TD delay?'.
I understand your timezone is different, so no urgency to respond.
Apologies in advance if I misunderstood the chart. Thanks.
robert.p.balanModeratorLeaderJan 27, 2021 7:03 AM
Surf -- I highlighted that because the way asset prices link to liquidity changes, in the flows -- the change rate of liquidity over time. It is impossible to compare liquidity flows and the nominal values of asset prices, so the price change rate is the link between asset prices and liquidity flows. There was a distortion in the relationship between liquidity and asset prices for most of H1 2020, and it is only now that liquidity seasonality is reasserting. Even in the covariance of assets as shown above, things started to get in sync only after July.
surfinusaJan 27, 2021 7:08 AM
Thanks. Understood. So we should be watching both lines in-sync to the right of TD265 with regards to possible price change (directional) pressure.
robert.p.balanModeratorLeaderJan 27, 2021 7:13 AM
The bond yields are most susceptible to changes in liquidity. In shares, you have the RobinHooders, you have earnings season, you have option traders trying to outsmart each other -- but after whatever hoohah that happens, equities still follow yields after a short lag sometimes up to three days.
That is why we look to the yields for guidance. The yield moves can sometimes come down to simple things like how much the Primary Dealers are buying or selling -- which makes total sense, as they are the bond market makers.
Which tells me that the Primary dealers may have been front running the FOMC decision today.

robert.p.balanModeratorLeaderJan 27, 2021 7:31 AM
This montage above leads me to believe that PDs have been offloading Treasuries for a few days now going into the FOMC (transaction rising, positioning becomes smaller). That seems clear, but we have to ask why? And the answer is not so obvious sometimes. Is it because they expect rates to go higher, or they are offloading stock so they can buy at a cheaper price?
Remember that the PDs KNOW in general terms what the Fed will do -- maybe not specifics, but the Fed does not leave its PDs in the dark, as it (the Fed) has to provide funding if the PDs are unable to buy what the US Treasury is selling (really nice situation, that is why every bank wants to be a PD).
The tell will be what happens to the PD positioning after this weeks FOMC. If the positioning increases, then yields are not going to go higher, and vice versa.
surfinusaJan 27, 2021 7:16 AM
Couple of interesting charts that might provide a clue as to which points to use for the Fib extensions. (I know - Curve-Fitting... but anyhow)..
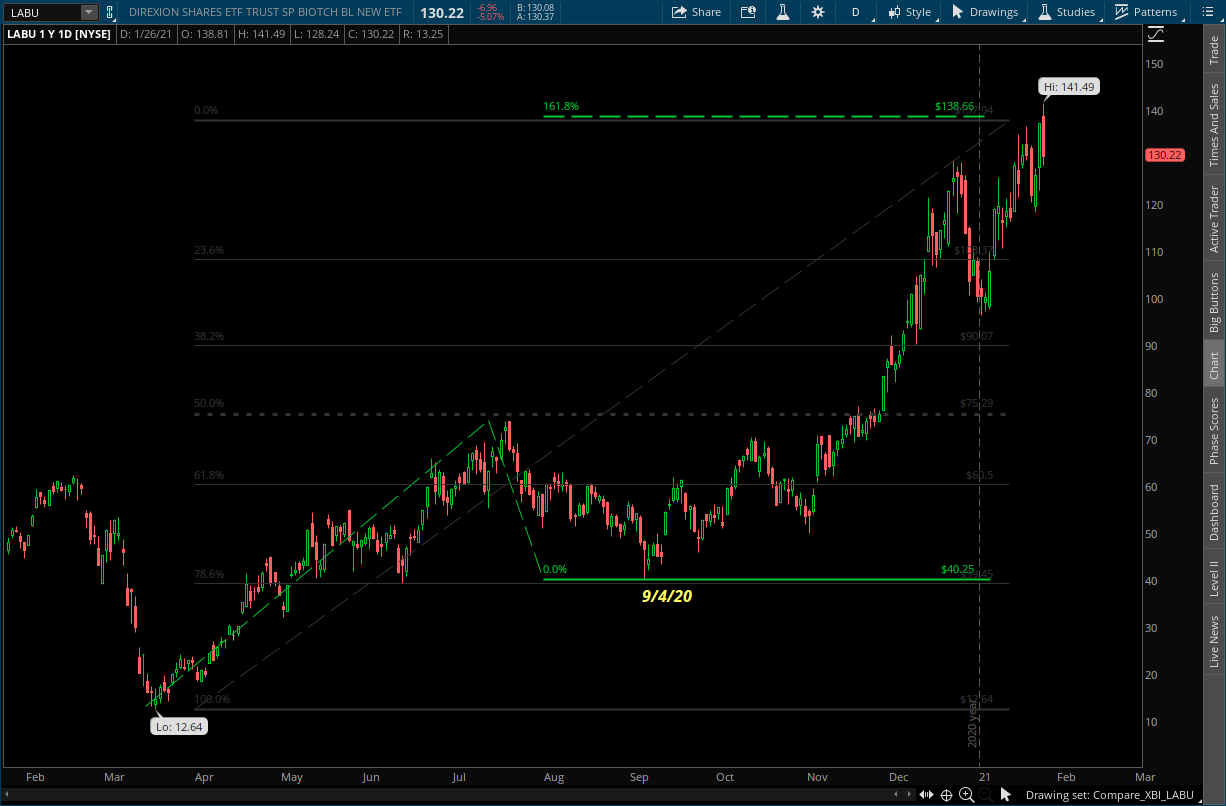
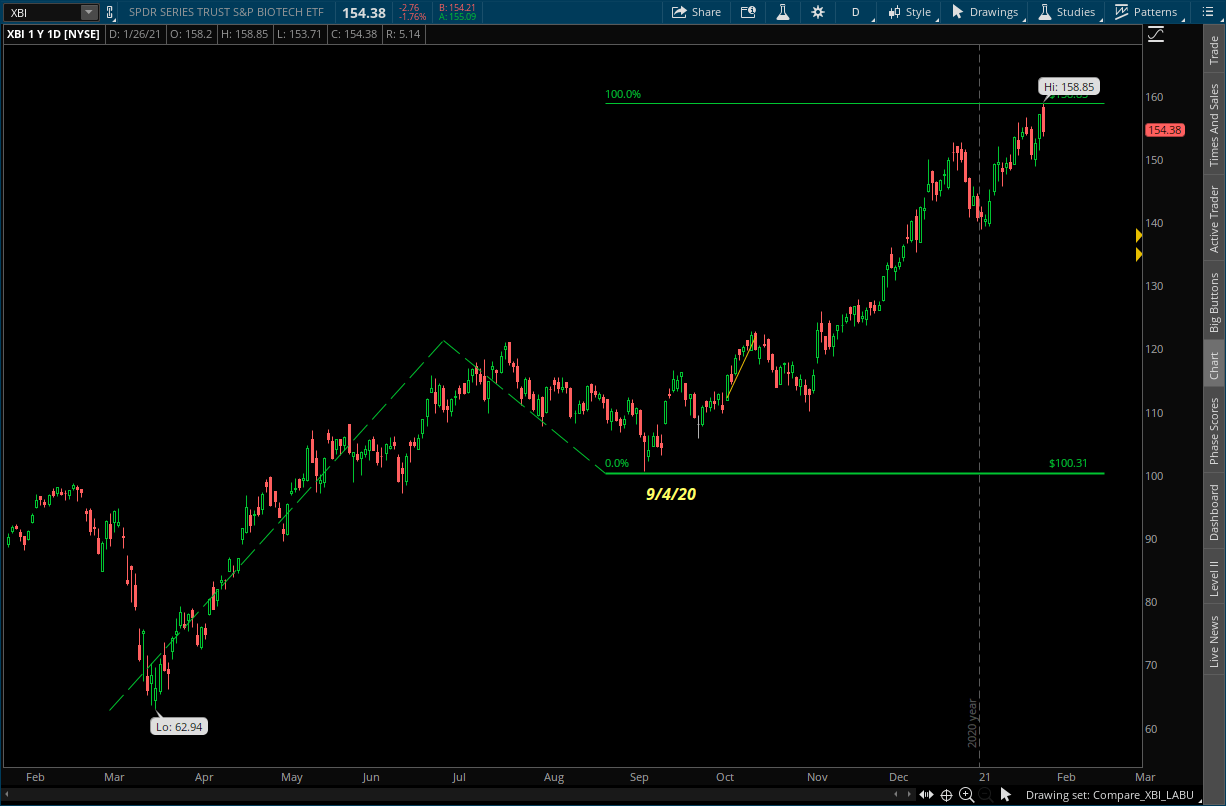 robert.p.balanModeratorLeaderJan 27, 2021 7:25 AM
I have the time now to check those Fib extensions, surf, and they are spot on. Thanks for this.
OK, that triangle in the yield is becoming very distinct now.
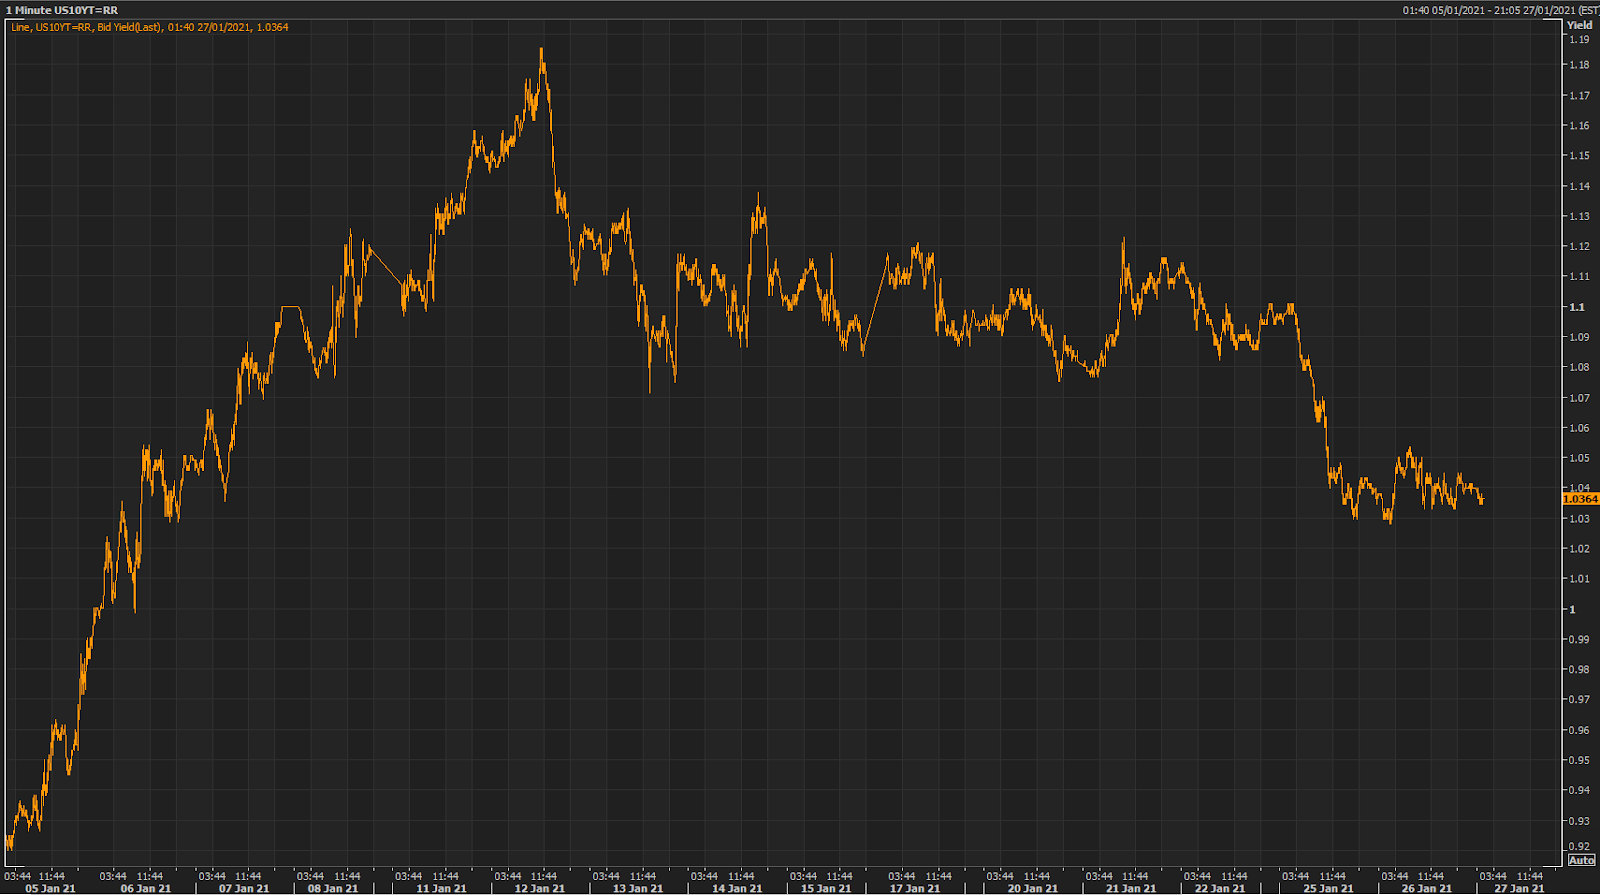
I think we will have transactions to be done by or after NY opens.
I will see you at the Europe open in a couple of hours. Gotta fill in that sleep quota. Ciao.
surfinusaJan 27, 2021 7:53 AM
GN
TO BE UPDATED AFTER NY CLOSE TODAY, JANUARY 27, 2020
------------------------------------------------------------------------------------
----------------------------------------------------------------------------------------
Here is the current status of the PAM flagship Swing Fund, which includes open and closed trades.
During the twelve months of 2020, PAM delivered phenomenal real-dollar Hedge Fund trading performance, the best at Seeking Alpha:
PAM's flagship Swing Portfolio, year-to-date (December 31, 2020) delivered $100, 181,522.77 net profit on $11,172,813 margin capital.
Year-to-date performance: 754.20%, on 888-98 win-loss trades.
December 2020 spreadsheet here:
Year to date 2020 spreadsheet here.
--------------------------------------------------------------------------------------

Comments
Log in or sign up to join the conversation.