
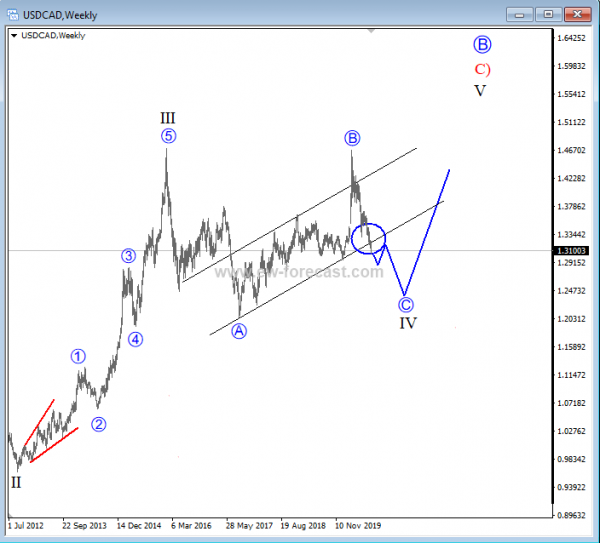
USD/CAD can be trading in a big, bullish cycle, however price activity from start of 2016 suggests the pair is being trapped in a complex correction of a higher degree wave IV. At the moment we see price reversing lower, ideally into a sub-wave C of IV, which is part of an Elliott wave flat, and which can decline towards the area of a former swing low of a wave A for support. That said, a break below the lower corrective channel line will confirm a sub-wave C of IV to be underway.
USD/CAD, weekly
A Flat is a three-wave pattern labeled A-B-C that generally moves sideways. It is corrective, counter-trend, and is a very common Elliott pattern.
Regular Flat:

- structure is 3-3-5
- wave B terminates about at the level of the beginning of wave A
- wave C terminates a slight bit past the end of wave A
- appears in wave two or four, wave B in an A-B-C, wave X in a double or triple zig-zag, or wave Y in triple threes


Comments
Log in or sign up to join the conversation.