
Today I used Barchart to find the Mid Cap stocks with the best momentum, technical indicators and charts. First I sorted the S&P 400 Mid Cap Index stocks for new high frequency in the last month, then used the Flipchart feature to review the charts for consistent momentum.
Today's list includes Abercrombie & Fitch (ANF), Energizer Holdings(ENR), Intersil (ISIL), Superior Energy Services (SPN) and Unit Corp(UNT):
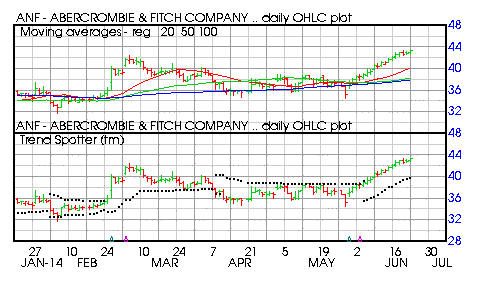
Barchart technical indicators:
- 96% Barchart technical buy signals
- Trend Spotter buy signal
- Above its 2, 50 and 100 day moving averages
- 18 new highs and up 16.60% in the last month
- Relative Strength Index 74.44%
- Barchart computes a technical support level at 42.68
- Recently traded at 43.17 with a 50 day moving average of 38.26
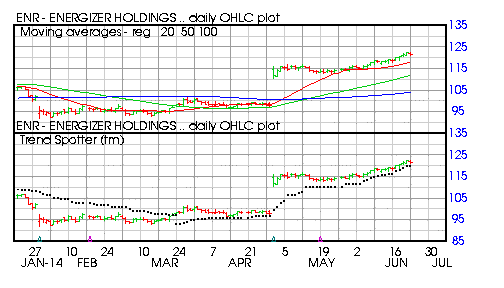
Barchart technical indicators:
- 88% Barchart technical buy signals
- Trend Spotter buy signal
- Above its 20, 50 and 100 day moving averages
- 16 new highs and up 6.29% in the last month
- Relative Strength Index 73.74%
- Barchart computes a technical support level at 120.06
- Recently traded at 121.15 wit a 50 day moving average of 111.9
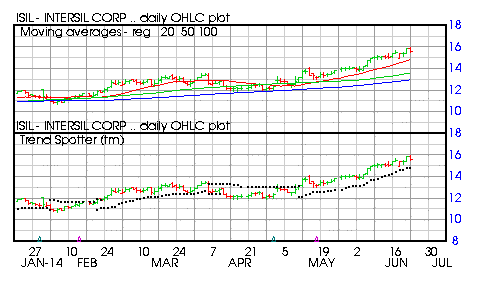
Barchart technical indicators:
- 96% Barchart technical buy signals
- Trend Spotter buy signal
- Above its 20, 50 and 100 day moving averages
- 15 new highs and up 12.60% in the last month
- Relative Strength Index 72.20%
- Barchart computes a technical support level at 15.20
- Recently traded at 15.53 with a 50 day moving average of 13.60
Superior Energy Services (SPN)
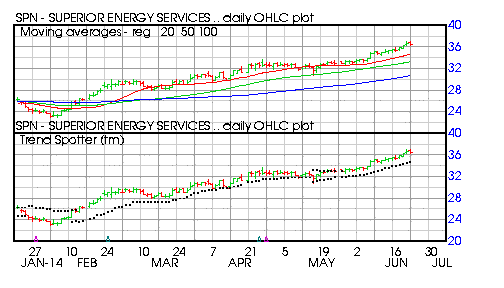
Barchart technical indicators:
- 96% Barchart technical buy signals
- Trend Spotter buy signal
- Above its 2, 50 and 100 day moving averages
- 15 new highs and up 10.34% in the last month
- Relative Strength Index 73.71%
- Barchart computes a technical support level at 35.91
- Recently traded at 36.52 with a 50 day moving average of 33.25
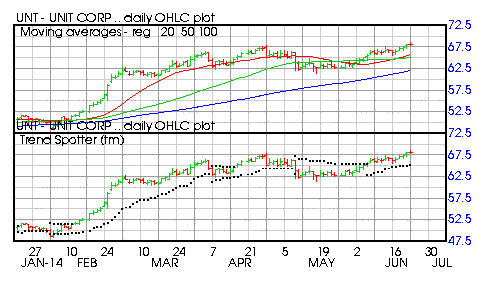
Barchart technical indicators:
- 96% Barchart technical buy signals
- Trend Spotter buy signal
- Above its 20, 50 and 100 day moving averages
- 14 new highs and up 8.49% in the last month
- Relative Strength index 69.94%
- Barchart computes a technical support level at 67.35
- Recently traded at 68.12 with a 50 day moving average of 65.04


Comments
Log in or sign up to join the conversation.