
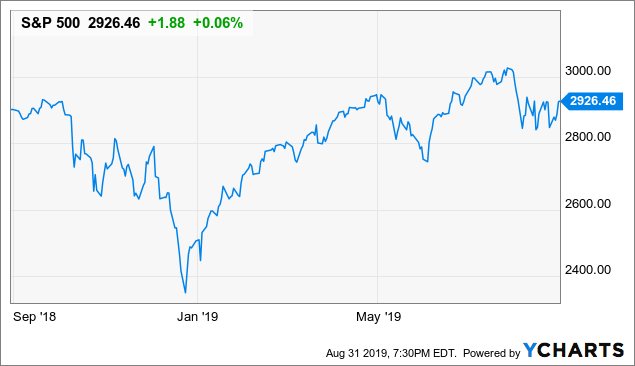
The S&P 500 has been basically flat in the past year, and there are growing concerns about the medium-term outlook for the index due to factors such as the economic slowdown in different countries, the trade war uncertainty and all the political noise affecting markets in recent weeks.
Data by YCharts
These factors are very real, and they can easily have a negative impact on the S&P 500. However, it's easy to miss the forest for the trees when you pay too much attention to the short-term news. The media tends to focus too much on the negative factors affecting the markets, so investors need to have an independent mindset to make an objective assessment of market conditions.
Market Breadth Remains Strong
The S&P 500 index is weighted by market capitalization. This means that price performance from the big stocks in the index can have a disproportionate effect on such an index.
For this reason, we need to analyze the price action under the surface when looking for clues about the underlying strength or weakness in the market. In that regard, the percentage of stocks in the S&P 500 holding above the 200-day moving average can be a particularly valuable indicator.
When this percentage broke below 50% in 2015 and 2016, this triggered a considerable pullback in the S&P 500. The same thing happened in the fourth quarter of 2018, the percentage of stocks above the 200-day moving average declined below 50%, and the index suffered a considerable drawdown at that time.
The S&P 500 index has been quite volatile in recent weeks, but the percentage of stocks trading above the 200-day moving average remains above the key threshold of 50%. The fact that most of the stocks in the index are holding on relatively well is a major positive in terms of evaluating the price action for the index under the surface.
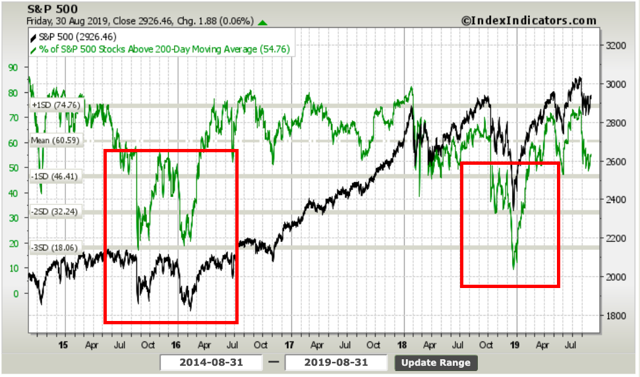
Source: IndexIndicators
Stocks Tend To Do Well After The Yield Curve Inverts
The inversion of the yield curve has produced lots of concern among investors, and it makes sense to follow this indicator closely. In simple terms, an inversion of the yield curve is reflecting that investors expect economic growth to slow down, so long-term rates are lower than short-term rates.
In theory, this could have a negative impact on stock prices, but this idea does not have a lot of support on historical evidence, and selling stocks only because the yield curve has inverted tends to be a losing proposition.
The lead time between inversions and recessions is quite inconsistent and hard to predict. According to data from Credit Suisse, a recession is observed on average 22 months after the inversion. Importantly, stocks tend to deliver solid returns after yield curve inversions more often than not.
Based on the historical data, the stock market tends to rally more than 15% on average in the 18 months following the inversion.
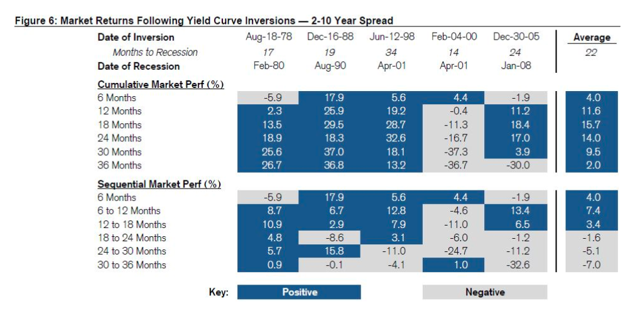
Source: CNBC
This may sound counterintuitive at first. If markets are expecting decelerating economic growth, how is that bullish for stocks?
The market return is always about the fundamentals in comparison to expectations, not about fundamentals in isolation. A low bar is easy to beat, when investors are expecting lackluster economic data, it's relatively easy for the data to outperform expectations in the short term.
The Credit Market Remains Healthy
When trying to take signals from the bond market, watching credit spreads can be more important than the absolute level of interest rates. Investors in fixed income are generally more risk-averse than investors in stocks. When the economic fundamentals are deteriorating, chances are that this will be rapidly reflected on rising credit spreads.
Besides, cheap credit is a major tailwind for both consumers and corporations. As long as credit remains cheap and abundantly available, the consumer will keep spending and companies will have plenty of resources to make the necessary investments while also rewarding shareholders with dividends and stock buybacks.
Looking at the historical evidence, when the stock market falls and credit spreads remain stable, this is many times a short-term dip and, ultimately, a buying opportunity. On the other hand, if credit spreads are increasing as the stock market is falling, this can signal that the situation is far more serious and concerning.
For illustrative purposes, the chart shows the evolution of the S&P 500 and high-yield credit spreads since 1999. It's easy to see how a big increase in credit spreads is generally a good indicator of tough times for the stock market. There are not many signs of financial stress in the credit market right now, so this is indicating that the overall environment is still favorable for stocks and other risky assets.
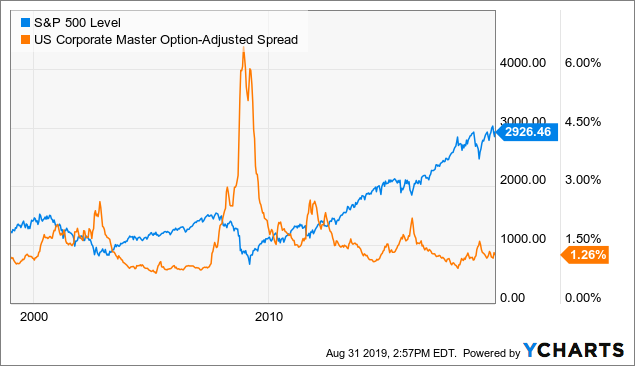
Data by YCharts
A Strong Jobs Market Is Good For Stocks
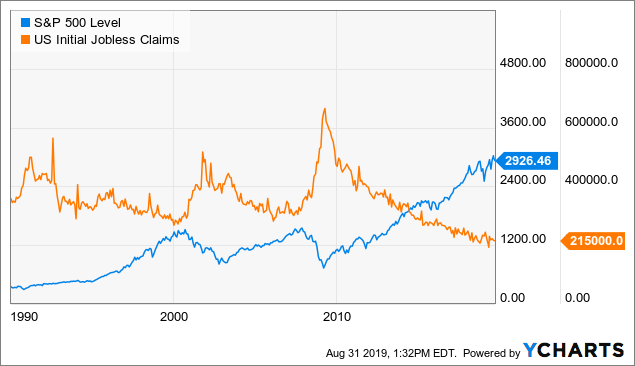
The jobs market remains remarkably solid across the board, and this has bullish implications for the S&P 500. The chart shows the evolution of initial jobless claims in comparison to the S&P 500 index since 1990.
In times when initial jobless claims are declining, the S&P 500 tends to perform quite well, and pullbacks are relatively shallow. Conversely, a big increase in claims can be a major red flag for stocks.
Data by YCharts
As of the time of this writing, jobless claims are at historic lows. This could easily change in the coming months, of course. If we see a deterioration in the jobs market, this would merit a reassessment of market conditions.
But it is what it is right now, and a strong market for jobs generally means a strong market for stocks too.
Being Greedy When Others Are Fearful
In the words of Warren Buffett himself, the time to be greedy is when others are fearful, and there is considerable negativity among investors right now. The chart below shows the evolution of the S&P 500 and the bullish levels in the AAII sentiment survey. When bullishness is as low as it is now, the S&P 500 generally performs well in the ensuing months.
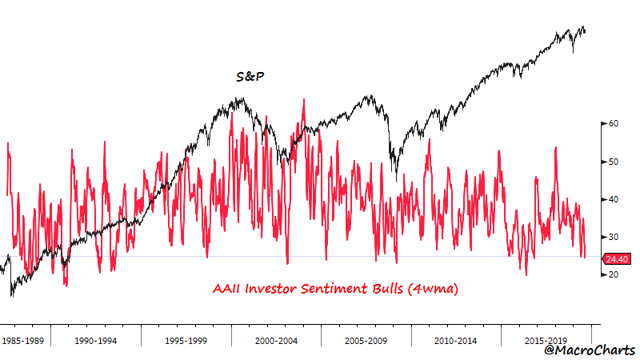
Source: @MacroCharts
A Weight Of The Evidence Approach
Most investors are well aware of the risk factors that could hurt the S&P 500 in the coming months, especially on the economic and political front. I am not saying that those risks should be ignored, on the contrary, if the environment gets worse, the right thing to do is acknowledge the new evidence and adjust portfolio risk accordingly.
However, bull markets climb a wall of worry. If past history is any valid guide, negative investor sentiment in times when the economy remains relatively healthy could create a buying opportunity for investors. The drivers that could push the S&P 500 higher are not as strident as the geopolitical factors that are pushing it down, but this does not make any of these bullish drivers any less powerful.
Statistical research has proven that stocks and ETFs showing certain quantitative attributes tend to outperform the market over the long term.


Comments
Log in or sign up to join the conversation.