
Today I wanted to see how 5 of the most popular stocks are doing, so I looked up their Barchart technical indicators and reviewed their charts. The list includes Apple (NASDAQ:AAPL), Google (NASDAQ:GOOG), General Electric (NYSE:GE), Microsoft (NASDAQ:MSFT) and Johnson & Johnson (NYSE:JNJ):
Apple (AAPL)
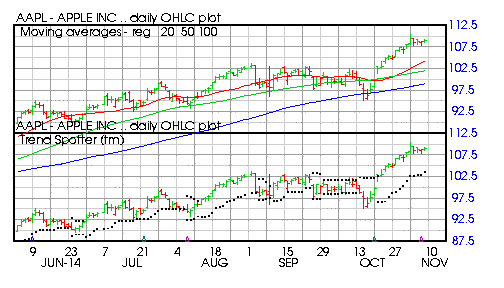
Barchart technical indicators:
- 56% Barchart technical buy signal
- Trend Spotter buy signal
- Above its 20, 50 and 100 day moving averages
- 7 new highs and up 5.67% in the last month
- Relative Strength Index 63.73%
- Barchart computes a technical support level at 107.27
- Recently traded at 108.20 with a 50 day moving average of 104.42
Google (GOOG)
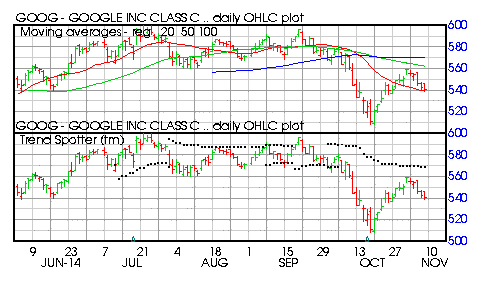
Barchart technical indicators:
- 46% Barchart technical sell signal
- Trend Spotter sell signal
- Above its 20 day moving average buy below its 50 and 100 day moving average
- 10.55% off its recent high
- Relative Strength Index 43.85%
- Barchart computes a technical support level at 537.38
- Recently traded at 541.01 which is below its 50 day moving average of 562.23
General Electric (GE)
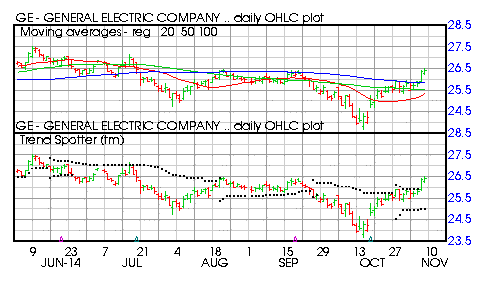
Barchart technical indicators:
- 48% Barchart technical buy signals
- Trend Spotter buy signal
- Above its 20, 50 and 100 day moving averages
- 10 new highs and up 6.45% in the last month
- Relative Strength Index 65.58%
- Barchart computes a technical support level at 26.08
- Recently traded at 26.41 with a 50 day moving average of 25.55
Microsoft (MSFT)
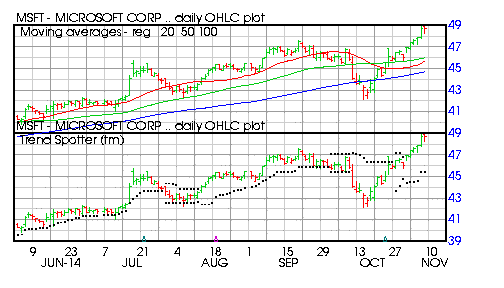
Barchart technical indicators:
- 80% Barchart technical buy signals
- Trend Spotter buy signal
- Above its 20, 50 and 100 day moving averages
- 8 new highs and up 6.92% in the last month
- Relative Strength Index 68.53%
- Barchart computes a technical support level at 47.38
- Recently traded at 48.68 with a 50 day moving average of 46.00
Johnson & Johnson (JNJ)
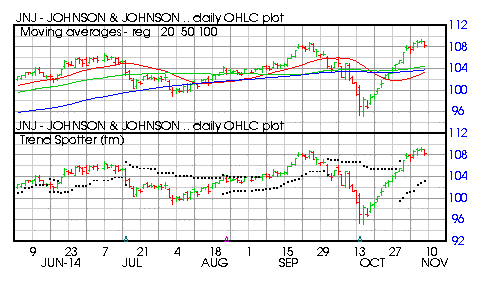
Barchart technical indicators:
- 56% Barchart technical buy signals
- Trend Spotter buy signal
- Above its 20, 50 and 100 day moving averages
- 7 new highs and up 5.67% in the last month
- Relative Strength Index 63.73%
- Barchart computes a technical support level at 107.27
- Recently traded at 108.20 with a 50 day moving average of 104.42


Comments
Log in or sign up to join the conversation.