
Today I decided to use Barchart to evaluate look at 5 more popular stocks' technical buy/sell indicators and charts. Today's list includes Ford (NYSE:F), Bank of America (NYSE:BAC), Cisco Systems (NASDAQ:CSCO), Citigroup (NYSE:C) and Netflix (NASDAQ:NFLX):
Barchart technical indicators:
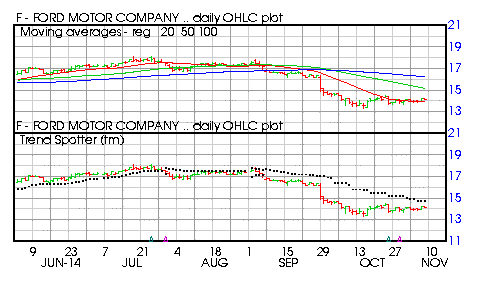
- 32% Barchart technical sell signals
- Trend Spotter sell signal
- Above its 20 but below its 50 and 100 day moving averages
- 21.80% off its recent high
- Relative Strength Index 45.77%
- Recently traded at 14.17 which is below its 50 day moving average of 15.17
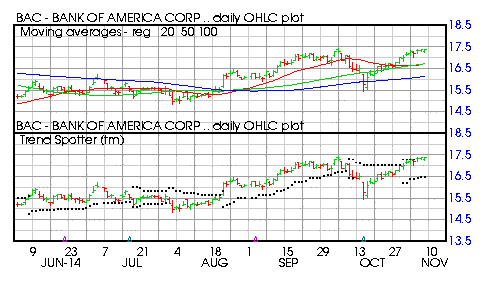
Barchart technical indicators:
- 96% Barchart technical buy signals
- Trend Spotter buy signal
- Above its 20, 50 and 100 day moving averages
- 6 new highs and up 2.84% in the last month
- Relative Strength Index 63.00%
- Barchart computes a technical support level at 17.16
- Recently traded at 17.36 which is above its 50 day moving average of 16.72
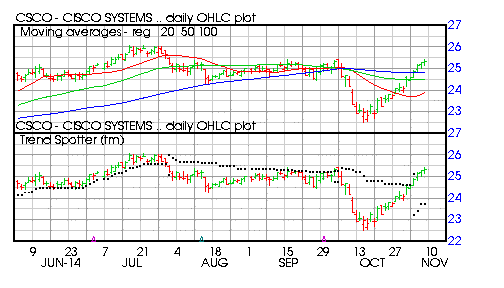
- 32% Barchart technical buy signals
- Trend Spotter buy signal
- Above its 20, 50 and 100 day moving averages
- 5 new highs and up 2.80% in the last month
- Relative Strength Index 67.52%
- Barchart computes a technical support level at 25.06
- Recently traded at 25.33 with a 50 day moving average of 24.51
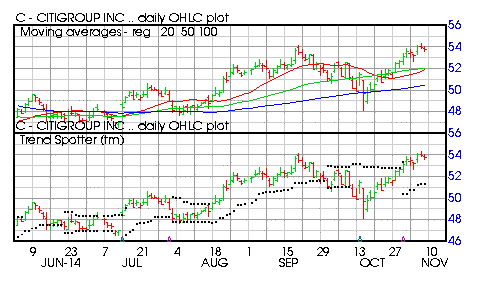
- 80% Barchart technical buy signals
- Trend Spotter buy signal
- Above its 20, 50 and 100 day moving averages
- 6 new highs and up 4.84% in the last month
- Relative Strength Index 61.36%
- Barchart computes a technical support level at 53.30
- Recently traded at 53.75 with a 50 day moving average of 52.05
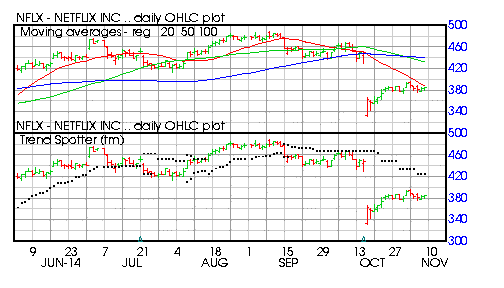
Barchart technical indicators:
- 64% Barchart technical sell signals
- Trend Spotter sell signal
- Below its 20, 50 and 100 day moving averages
- 21.49% off its recent high
- Relative Strength Index 40.79%
- Recently traded at 384.16 which is below its 50 day moving average of 432.06


Comments
Log in or sign up to join the conversation.