

It is important to find stocks that seem to be just starting to break out of their current patterns. The easiest way is to take the stocks in an index like the S&P 400 Mid Cap Index and use Barchart to sort them by the number of up days they have had in the last month.
Today's list includes Hill-Rom Holdings (NYSE:HRC), Rosetta Resources (NASDAQ:ROSE), SM Energy (NYSE:SM), Dean Foods (NYSE:DF) and California Resources (NYSE:CRC).
Hill-Rom Holdings
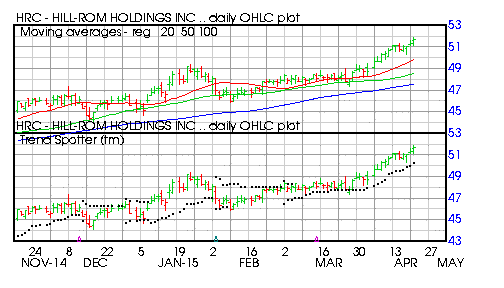
Barchart technical indicators:
- 96% Barchart technical buy signals
- Trend Spotter buy signal
- Above its 20, 50 and 100 day moving averages
- 14 new highs and up 7.73% in the last month
- Relative Strength Index 76.95%
- Barchart computes a technical support level at 50.88
- Recently traded at 51.72 with a 50 day moving average of 48.55
Rosetta Resources
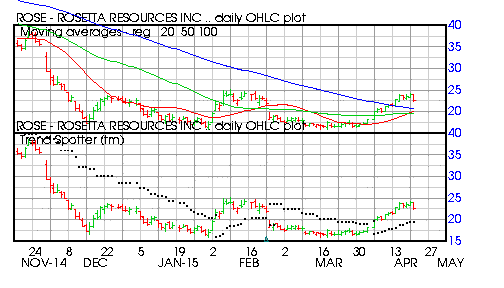
Barchart technical indicators:
- 48% Barchart technical buy signals
- Trend Spotter buy signal
- Above its 20, 50 and 100 day moving averages
- 14 new highs and up 35.91% in the last month
- Relative Strength Index 62.55%
- Barchart computes a technical support level at 22.52
- Recently traded at 22.52 with a 50 day moving average of 19.68
SM Energy
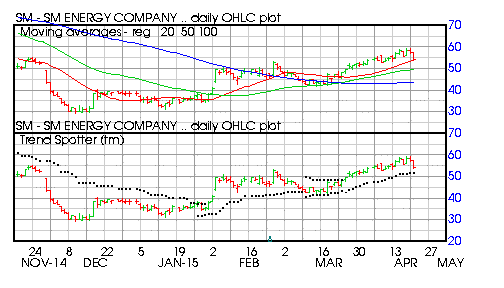
Barchart technical indicators:
- 56% Barchart technical buy signals
- Trend Spotter buy signal
- Above its 20, 50 and 100 day moving averages
- 13 new highs and up 14.63% in the last month
- Relative Strength Index 53.50%
- Barchart computes a technical support level at 51.49
- Recently traded at 53.98 with a 50 day moving average of 49.47
Dean Foods
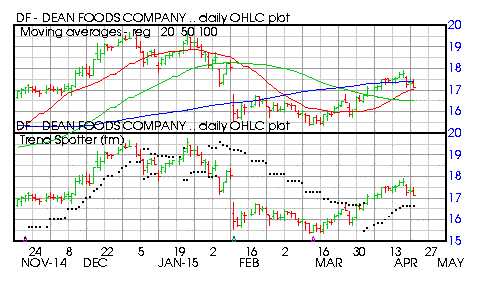
Barchart technical indicators:
- Trend Spotter buy signal
- Above its 20 and 50 day moving averages
- 13 new highs and up 6.00% in the last month
- Relative Strength Index 52.99%
- Barchart computes a technical support level at 16.89
- Recently traded at 17.13 with a 50 day moving average of 16.49
California Resources
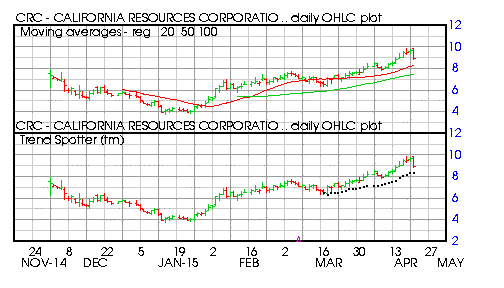
Barchart technical indicators:
- Not Rated - Barchart needs 6 months of data to form an opinion
- Above its 20 and 50 day moving averages
- 13 new highs and up 21.38% in the last month
- Relative Strength Index 62.02
- Recently traded at 8.97 with a 50 day moving average of 7.47



Comments
Log in or sign up to join the conversation.