
There are now at least 4 key ingredients drawing upon investor fears and which have resulted in a May, month-long market downturn. The S&P 500 (SPX) finished down 2.6% from last week and 1.3% on Friday. (Chart from Advisors Perspectives)
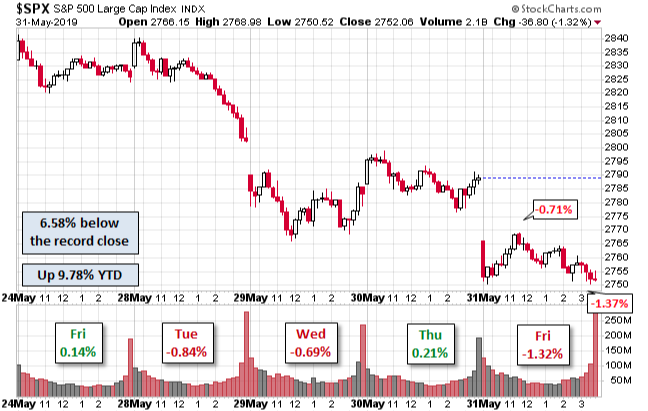
And the cause of the month-long sell-off, resulting in a 6.58% drawdown:
- Hike in tariffs on imports from China and subsequent retaliatory tariffs on U.S. exports to China.
- Crude oil prices dropping from $63.81 in mid-May to $53.36 to end the month.
- U.S. Treasury yields dropping (10-year) from roughly 2.6% to 2.13% to finish the month and multiple points across the yield curve inverting.
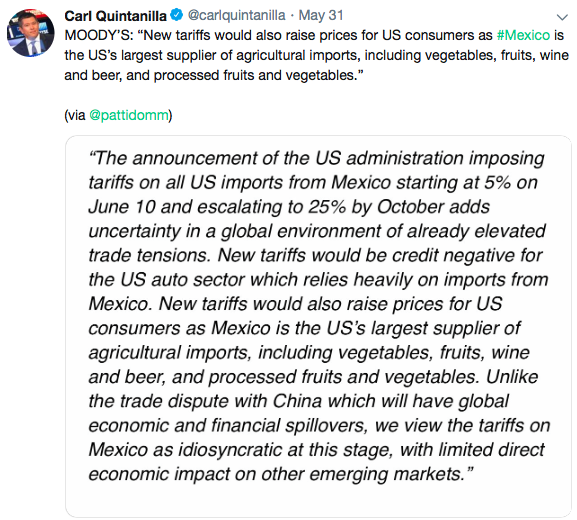
- U.S. announcing tariffs to be implemented on Mexico on June 10th if the Mexican administration does not aid in curtailing cross border illegal immigration.
Firstly, what investors will hear a great deal about in the coming weeks is the term used to describe the S&P 500’s recent high, “triple top”. As a stand-alone description, it sounds ominous. The word “top”, to market participants, insinuates the end of the bull market has occurred, and that’s what brings about a bear market. The following chart identifies this triple topping pattern.
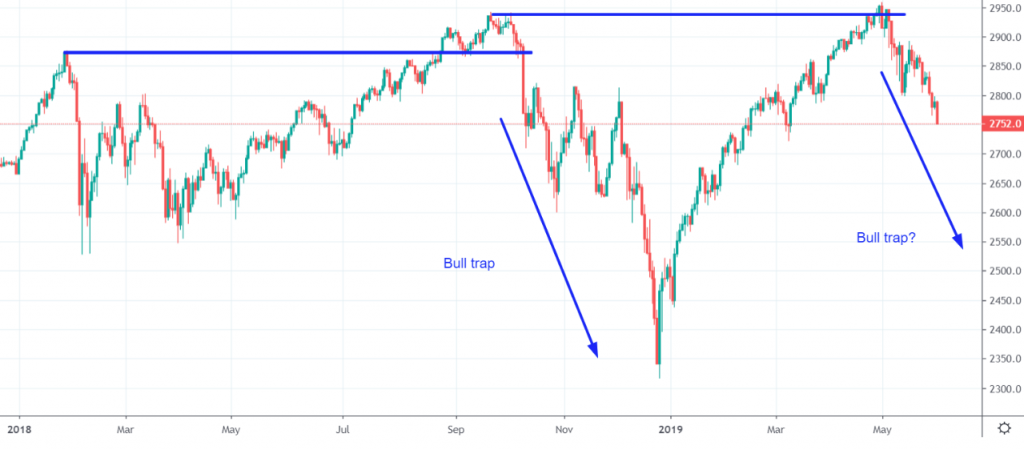
Here’s what we know for sure: The market made a new high in January 2018, then fell some 13% (intraday) over the next couple of months before climbing to a new all-time high in September 2018. It was at this time the market began to roll over into October for which the description of the S&P 500 then was characterized as having “double topped”. The market proceeded to fall roughly 20% from the September highs. The end was nigh; or was it?
The doomsayers and permabears would have had investors believe the market was readying to fall another 20% and a recession was in the making. As they forecasted doom, the market did nothing but rally from the Christmas Eve bottom through April, up 4 consecutive months and capturing yet another all-time high on the S&P 500. A double top is nothing more than a set up for the next all-time high; it’s just a matter of when. A triple top is nothing more than a set up for the next all-time high; it’s just a matter of when. For the answer to that “when” proposition, we lean on the macro-fundamentals that support or detract from corporate earnings. But before we get to the fundamentals, let’s look at some statistical situations of “market tops”.
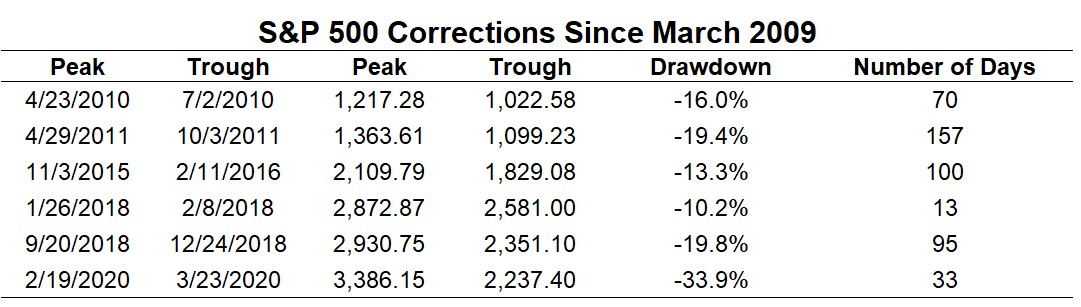
The criterion we shall use is offered by Bullmarkets.co: Cases in which the S&P makes a -15% to -20% correction, makes a marginal new high of less than +4%, and then immediately falls more than -4 percent. The current situation is that the S&P fall -19.6%, make a 0.6% new high, and then fall -6.5 percent.
- 2015-2016: The S&P fell -14.16%, made +2.7% new high and then fell -4.7%. Eventually, the bull market resumed.
- 2011: The S&P fell -19.38%, made +4.06% new high and then fell -9.92%. Eventually, the bull market resumed.
- 1998: The S&P fell -19.33%, made +0.4% new high and then fell -4.22%. Eventually, the bull market resumed.
Besides the 4 noted occurrences whereby the market topped then retraced then resumed the bull market rally, 2 other occurrences dating back to the 1960s, which we believe are less relevant as they happened before the modern economic era. The most important takeaway from the study and representations of like occurrences suggests the current situation is perfectly normal. Having said that, it is also perfectly normal to fall prey to fear given that the most recent technical bear market bottom was only 5 months ago. Recency bias can be very dangerous for investors and find them underperforming as emotions run rampant, selling stocks at the bottom and chasing stocks at the top. When it comes to a bull market ending, typically bull markets don’t end with minimal new highs, but rather a more elongated period of highs and economic excesses that perversely result in abundant leverage build-up. Such conditions aren’t present in the current economic cycle.
Speaking of recency bias, the current market drawdown is indeed different than what we witnessed in Q4 2018. The May 2019 selloff was not preceded by an A/D Line divergence, which means it is very likely to NOT be part of a big decline. (See chart below)
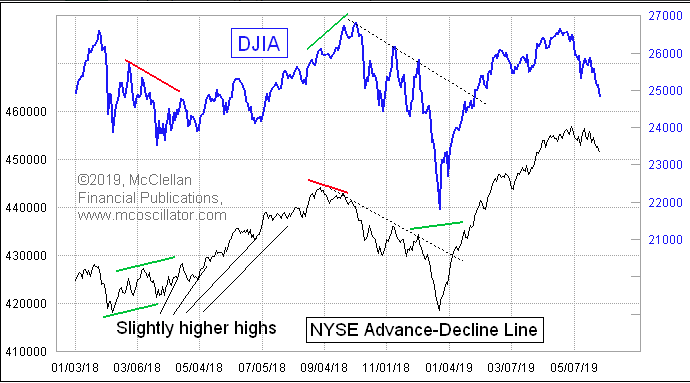
A lack of divergence suggests liquidity is sufficient, something lacking in Q4 2018. Market might have other problems, but they are easier to get past when liquidity is still sufficient. Nonetheless, compared to 2017 and 2016, liquidity remains relatively low.
While we aren’t of the opinion the bull market cycle has peaked, further market downside is the higher probability near-term and with respect to the aforementioned bullet points. While the market has plunged 6.58% through May, oversold conditions suggest the market still has some more downside when reviewing the number of SPX stocks above their 50-DMA, even if the Put/Call ratio hit its highest level just this past week and since December 2018.
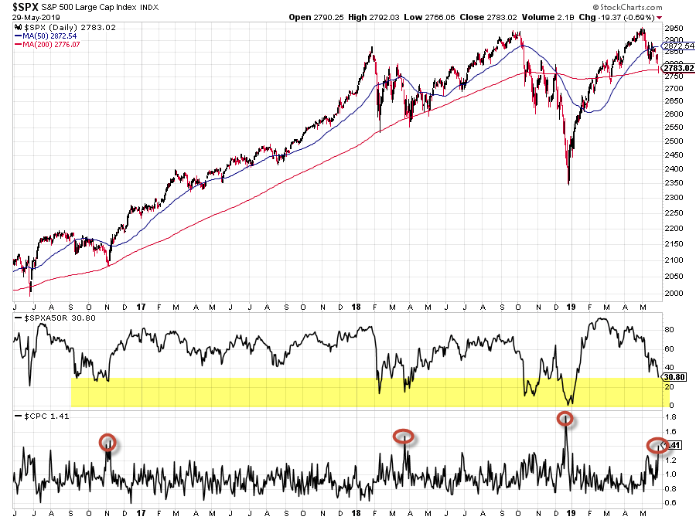
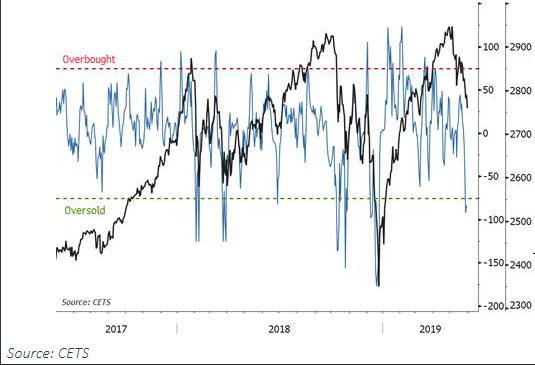
In an effort to magnify our point on oversold conditions, we can certainly look at other oscillators and sentiment indicators that validate oversold conditions. Citi overbought/oversold signal hit oversold this past week.
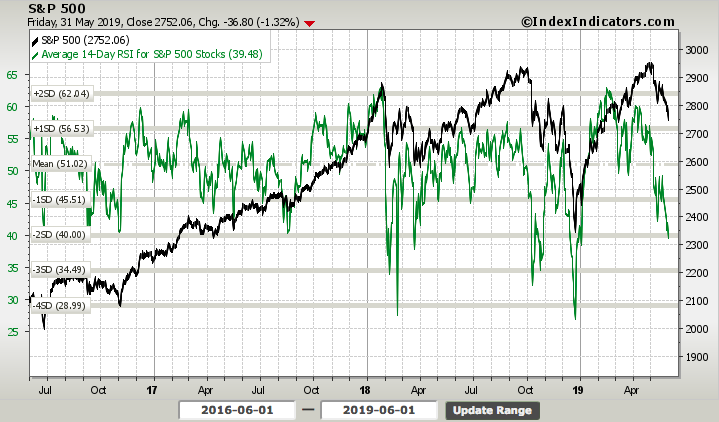
The S&P 500 14-day RSI is weak, but it has been far weaker than the present reading of roughly 40. This also indicates we may still have more downside before ultimate panic sets into the market.
Alongside general market indicators, investor sentiment has taken a hit throughout May, as reported in the weekly AAII survey of individual investors. The latest reading shows below historic average bullishness and above historic average bearishness.
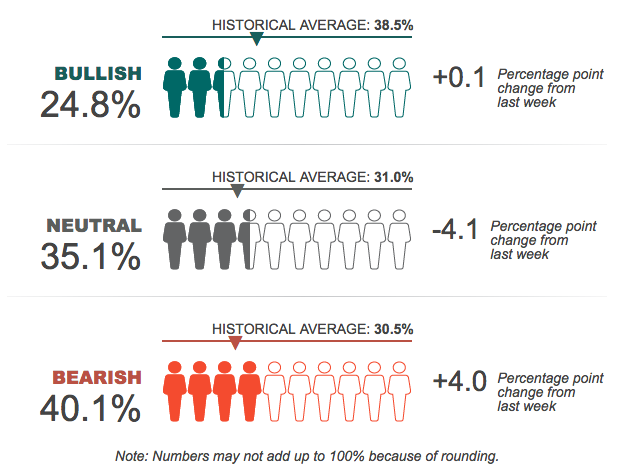
Two out of five individual investors are pessimistic about the short-term outlook for stocks. The latest AAII Sentiment Survey also shows a pullback in neutral sentiment and a very slight change in optimism.
Bullish sentiment, expectations that stock prices will rise over the next six months, increased 0.1 percentage points to 24.8%. Optimism was last lower on December 12, 2018 (20.9%). This is the 15th time this year that optimism is below its historical average of 38.5 percent.
Bearish sentiment, expectations that stock prices will fall over the next six months, rebounded by 4.0 percentage points to 40.1%. Pessimism was last higher on January 2, 2019 (42.8%). This is the third consecutive week that bearish sentiment is above its historical average of 30.5 percent.
Pessimism is now at an unusually high level (more than one standard deviation above its historical average). The breakpoint between typical and unusually high readings is 39.8%. Optimism remains at an unusually low level, below the breakpoint of 28.1%. Historically, unusually low levels of bullish sentiment and unusually high levels of bearish sentiment have been followed by higher-than-median six-month returns for the S&P 500 index.
- Approximately 20% of survey respondents say any positive impact from earnings is being offset by the trade war.
- Seventeen percent of respondents think earnings are near a cyclical top or don’t support the current level of valuations.
- About 18% view first-quarter earnings as a positive for stocks.
Additionally, if we presume the current geopolitical skirmishes serve to further weaken global growth, investors are likely to attempt to price in such weakness in their EPS outlook. With this in mind, oversold conditions can persist for longer periods of time even if statistical metrics and sentiment surveys suggest a bounce higher in markets should occur near-term. What we can also assume is that if a bounce should present itself, investors are likely to use such a bounce as an opportunity to lighten equity exposures in favor of cash, as economic uncertainty remains front of mind.
In the previous trading week, we witnessed a breach of the weekly expected move ($52/points). For the week ahead, the weekly expected move for the S&P 500 is $58/points. The expected move is higher than the previous week given the rise in volatility that is fronted with hedging activity.
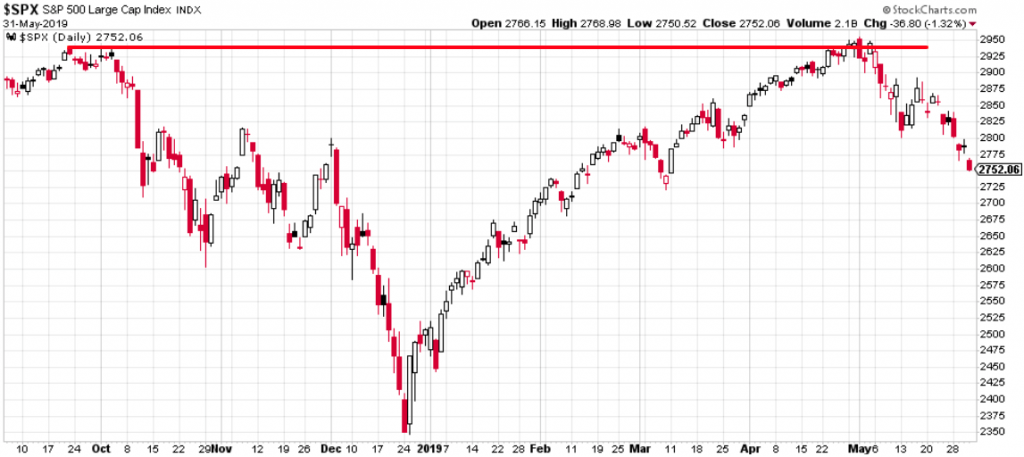
On a positive note, if you believe in the theory of “gap fills”, the market may rise to fill an existing gap should there be positive developments in the macro outlook, precipitated by positive trade headlines. And what is a gap you might ask? A gap is an empty space between 2 price bars. Gaps, especially those created by falling prices, are like magnets for price. Over the past decade, every single gap lower has been closed eventually. It’s not terribly scientific as all gaps created on the downside are eventually filled because markets simply move higher over time. Nonetheless, as shown in the following chart, there is an open chart gap at SPX 2,851.11.
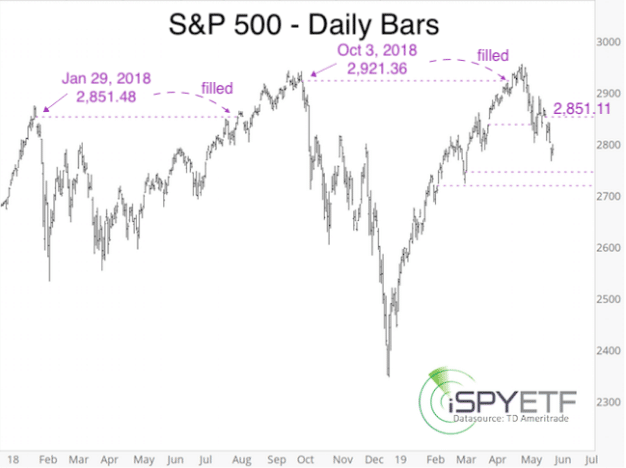
There are two lower gaps at 2,744.13 and 2,718.05 that may want to get filled before the S&P 500 gets a chance to close the 2,851.11 gap.
The Geopolitical Conflicts
What kicked off the market downturn in May was the tariff increases on China, announced in early May, but the United States. What resulted thereafter was the anticipated “tit-for-tat” feuding between the U.S. and China, whereby the U.S. placed restrictions on China’s Huawei business and implemented new tariffs on mattresses. In response, now China is investigating the U.S. packaging and shipping giant FedEx (FDX).
The U.S. Administration is also threatening to increase the current 25% tariff on $200bn worth of Chinese imports to include another $300bn worth of imports near-term. The escalating feud presumes China reneged on a previous agreement between the two parties, yet to be made official. In response to this threat of continued tariffs, Beijing has fired back with its own threat.

Beijing threatened to restrict rare-earth mineral exports to the U.S. China controls about 35% of the world’s rare-earth reserves, which are critical for a wide range of key industries including tech, automotive and defense among others. The U.S. is heavily reliant on imports to meet its rare-earth needs and 80% come from China.
The threat to restrict rare-earth minerals comes amid increasingly militaristic rhetoric from Beijing. A commentary in the People’s Daily, the country’s largest newspaper, cautioned the U.S. not to underestimate China: “Don’t say we didn’t warn you!”
The latest headline in the trade feud unfolded Sunday morning when China released a white paper that outlines its stance and understandings of the current state of affairs betwixt the two parties. (See video of press conference)

The Chinese government laid out its position on trade talks with the U.S., amid uncertainty about whether the two sides will return to the negotiating table and growing concern that the trade war will only continue to escalate.
So what does this all mean or what can it portend for the global and U.S. economy specifically. Bloomberg economists Dan Hanson and Tom Orlik have mapped out the main scenarios. Their headline conclusion: If tariffs expand to cover all U.S.-China trade, and markets slump in response, global GDP will take a $600 billion hit in 2021, the year of peak impact. Two years out, Bloomberg Economics’ modeling suggests that output in China and U.S. would be lower by 0.5% and 0.2% respectively, relative to a no-trade-war scenario.
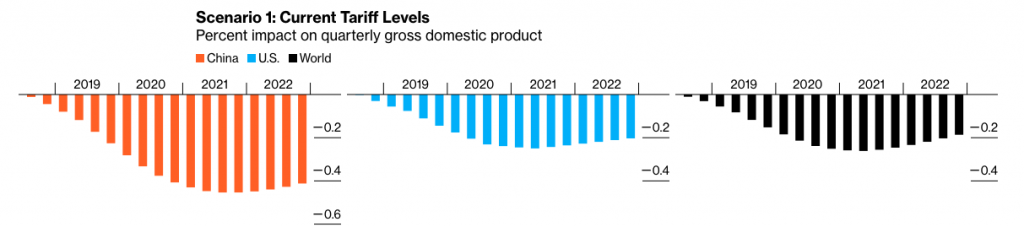
Plugging in 25% tariffs on all bilateral trade, the model shows output declines of 0.8%, 0.5% and 0.5% for China, the U.S. and the world in mid-2021.

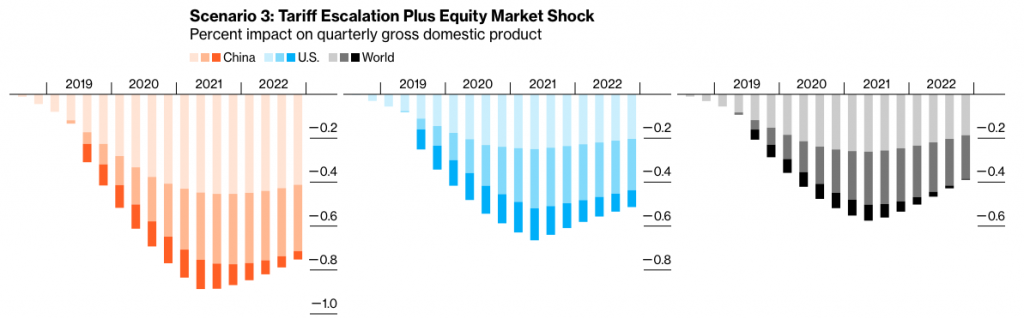
Hanson and Orlik’s nightmare scenario adds a 10% equity market drop to the across-the-board 25% tariffs. In that case, China, U.S. and world GDP would be 0.9%, 0.7%, and 0.6% lower in mid-2021. In this situation, the equity market drop acts as a further headwind to consumption and investment, compounding the impact.
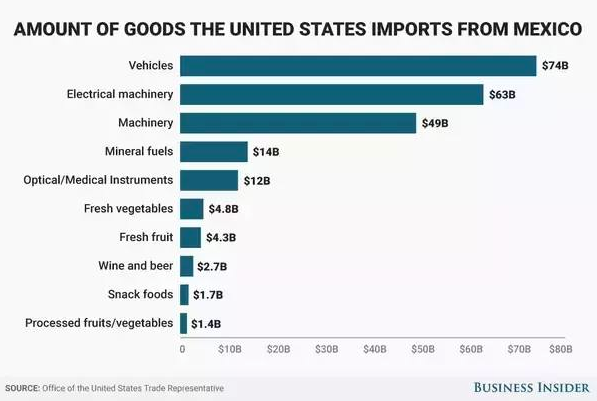
The problem with the aforementioned and demonstrated models is that they were assumed prior to the latest trade headlines surrounding the U.S. and it’s neighbor to the south, Mexico. On Thursday night last week, the U.S. Administration announced its intentions to place tariffs on Mexico at a clip of 5% and should the Mexican Administration not aid with improving illegal border crossings.
This announcement came straight “out of left field” so to speak. The USMCA had just been submitted to Mexico’s Senate for approval and is still being ratified by U.S’ Congress for which the tariff threat throws the whole USMCA into a state of flux. While many market participants have floated ideas of why this latest threat was put into play by the White House, the end result is the uncertainty it breeds with businesses and their future spending. Investors are equally baffled, for which has been witnessed in continued equity selling/outflows and bond buying/inflows.
The latest threat against Mexico could certainly be a mere tactic to play to President Trump’s base, with an election year looming. It offers him the ability to say he did everything within his power to promote a safer southern border and reduce illegal immigration by appealing to both the U.S. Congress and directly to Mexico’s President. But should the threat be realized with tariffs implemented, the intertwined economies could be found reeling rather quickly.

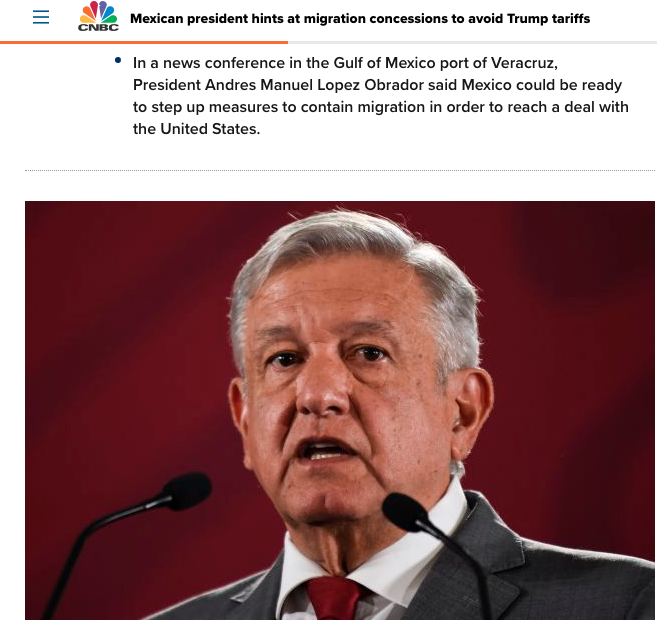
With all the threats of tariffs and potential for economic fallout around the globe, a ray of light is peeking out from behind the clouds that may ultimately bring the full scope of the sun by midweek. Mexico’s president on Saturday hinted his country could tighten migration controls to defuse U.S. President Donald Trump’s threat to impose tariffs on Mexican goods, and said he expected “good results” from talks planned in Washington next week.
A Mexican delegation led by Foreign Minister Marcelo Ebrard will discuss the dispute with U.S. officials in Washington on Wednesday, and Lopez Obrador said he expected “good results” from the talks, and for a deal to emerge.
“The main thing is to inform about what we’re already doing on the migration issue, and if it’s necessary to reinforce these measures without violating human rights, we could be prepared to reach that deal,” Lopez Obrador said.”
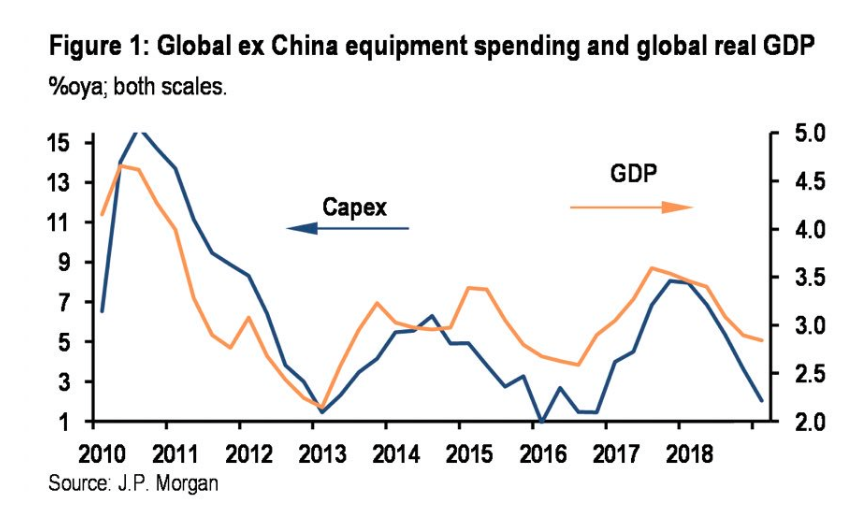
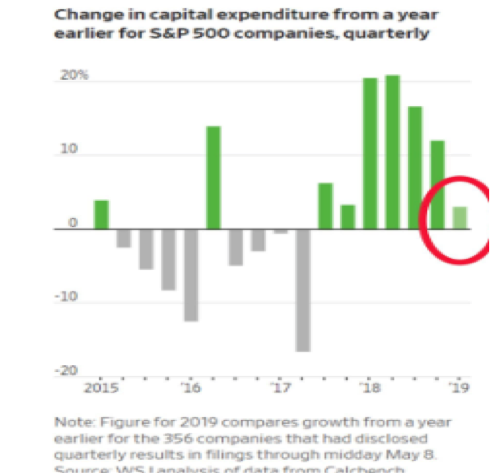
So let’s fast forward and presume the Mexico/U.S. skirmish ends amicably and no tariffs are applied. Two words come to mind: So what! Businesses will not easily forget the impulsivity expressed by the White House that seemingly defies the understanding that tariffs only serve as a tax on the U.S. corporations importing from tariffed nations, whom hope to be able to pass along such a tax to the U.S. consumer. The same can be said of the nearly 1-year long trade dispute and existing tariffs between the U.S. and China, which has resulted in the slowest Capex spending since Q4 2017.
So what if the tariffs are removed? What can we expect next out of the White House Administration, which has literally been battling on several fronts throughout the current term?
While we certainly are painting a more dismal forward-looking picture than may come to pass, these are the considerations investors need to ponder going forward. At present or up to this point, we admittedly see business sentiment and surveys proving resilient.
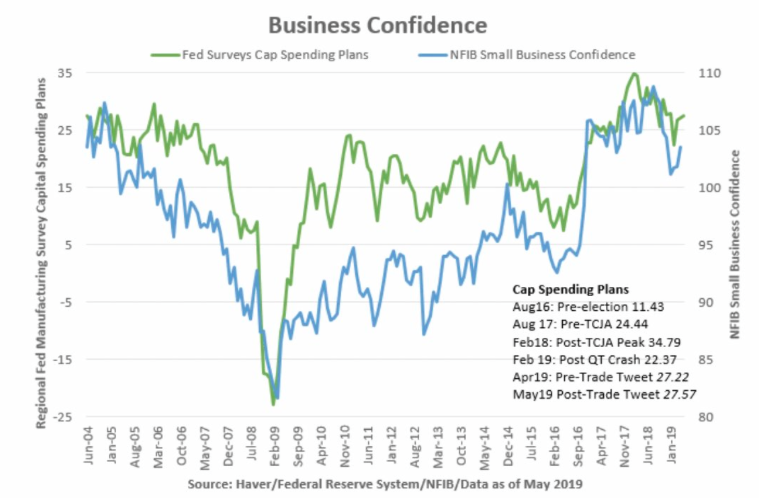
But this resiliency will be further tested in the near-term and until greater clarity can be found on the trade front. Capex spending has worsened YoY and has a direct impact on future economic outcomes.
My suggestion to investors after taking all the aforementioned into consideration and with respect to portfolio management:
“Cash is a greatly qualified position given all the obstacles facing the market near-term. With earnings having grown in the Q1 2019 period at a rate of roughly 1.5%, the outlook for FY 2019 earnings could still come under pressure as analysts ratchet up the worst-case scenario. We can discuss tariffs all day, but we must maintain a watchful eye on the implications from earnings forecasts as well. With cash in-hand, investors can afford themselves the time to allow the geopolitical issues to move more into focus and resolution, while trading in the interim with light positioning on a weekly basis.”
Yield Curve Inversion
One could make the argument that if it weren’t for all the geopolitical angst, we wouldn’t be talking about a yield curve inversion, but here we are. The U.S. bond yield curve has various points of inversion, but the most widely watched is the present 3-month/10-year inversion. Banks take in deposits at the short end of the yield curve and lend out at the long end of the curve. This leads many to believe that the current inversion will curtail the profitability for lending amongst the nations largest lenders. But traditional bank lending has undergone a good deal of ratification since the financial crisis and shadow bank lending has become a significant factor in the new lending era. Nonetheless, recession risks loom given the history of yield curve inversions. According to J.P. Morgan Chase, such recession risks have risen during the month of May.
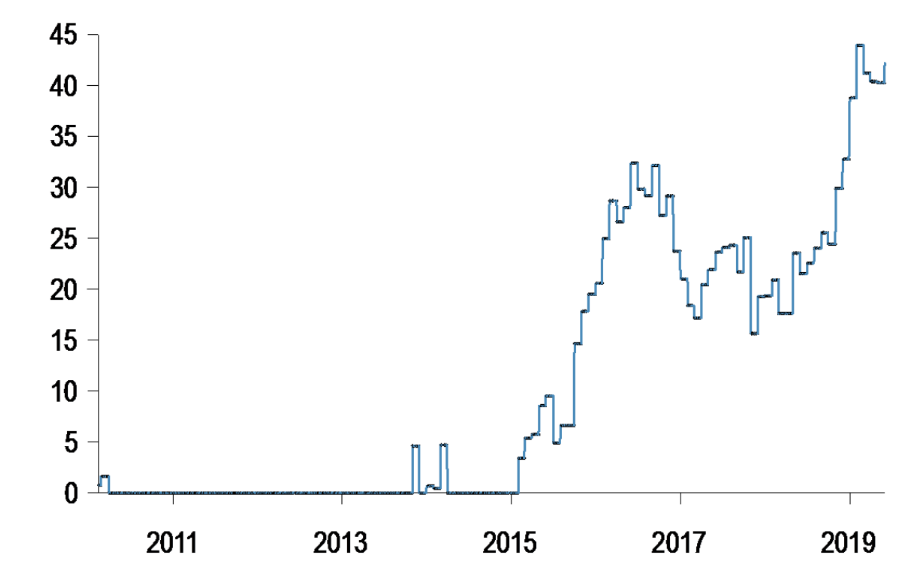
J.P. Morgan’s economists' model shows that the probability of a U.S. recession occurring in the next year has inched up to above 40% again.
Morgan Stanley’s Mike Wilson suggests that global economic activity and capital spending woes have been raising the probability of a recession also. The latest yield curve inversion only serves to validate the thesis and raises the risk of the S&P 500 possibly falling to 2,400 in the next few months according to the strategist.
“We think this means the U.S. economic slowdown and rising recession risk is happening regardless of the trade outcome.”
It’s important to note all the variables that are resulting in the yield curve inverting, which are nuanced and unique to the current economic cycle/expansion. While many, including Mike Wilson, suggest the yield curve inversion is a result of economic activity; factors other than economic activity may sometimes have a hand in inversions, including:
- Higher than normal demand for longer maturity Treasury bonds resulting in lower longer-term yields. One such driver of demand for longer-dated maturities has been the Federal Reserve Board’s quantitative easing policy, which has been keeping the longer-dated term premium (a component of yield) suppressed.
- Increased demand for U.S. bonds by foreign investors, who have been facing record low rates for nearly a decade now and have chosen to invest in U.S.-dollar-denominated Treasury bonds.
- Deterioration in global growth outside the U.S. For example, the 10-year bund yield fell into negative territory due to continued weakness in the German economy. If global growth remains weak, U.S. rates could continue to be influenced by global rates, without necessarily implying a higher risk of a U.S. recession.
Thomas Lee, head of Fundstrat Global Advisors, says not all inversions are created equal and compared the current inversion with the situation seen in 1998. He said that when the yield curve inverts because demand for the 10-year Treasury is driving rates lower, it tends to reflect growing worries about risk rather than presaging a slowdown in the business cycle.
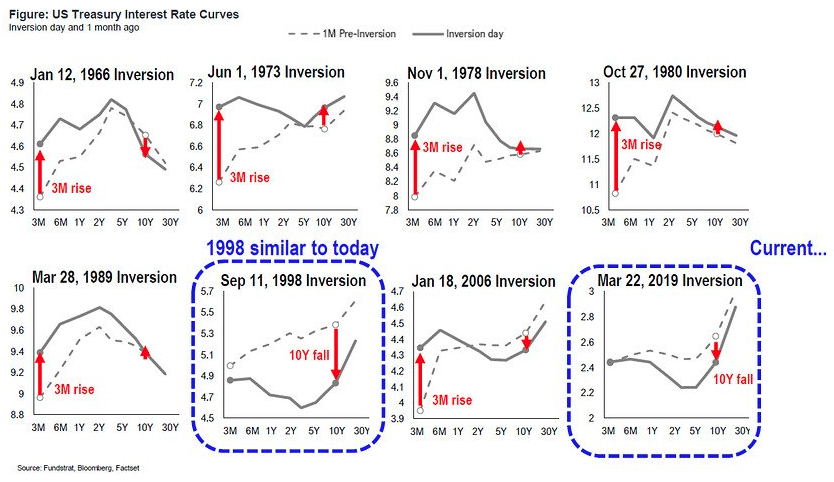
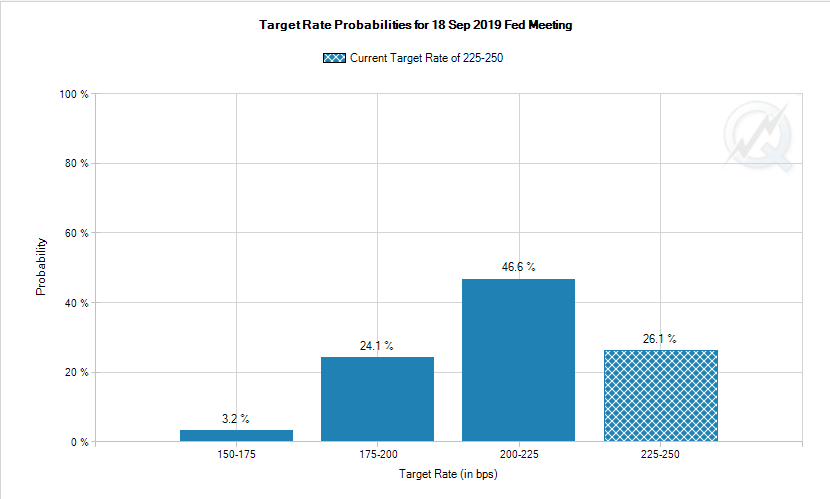
In addition to Thomas Lee’s comments, for this particular inversion, the 10-year is actually falling onto and below the 3-month Treasury yield. Usually, it is the other way around. With the yield curve inversion greatly worsening to its worst level in the current expansion cycle (22 bps), investors are pricing in two Fed rate cuts. The first rate cut is now expected to come by September and is given a greater than 70% probability of taking place, as outlined in the CME FedWatch Tool.
The market is clearly calling for a Fed rate cut if not 2 cuts by year’s end. Such a move would also demand a shift in the Fed’s language in the very near future if not the very next FOMC 2-day meeting. With that in mind, vice chairman of the FOMC Richard Clarida may already be signaling a language shift with his speech last week. The vice chairman on Thursday identified factors that would cause the central bank to lower interest rates.
“If the incoming data were to show a persistent shortfall in inflation below our 2% objective or were it to indicate that global economic and financial developments present a material downside risk to our baseline outlook, then these are developments that the Committee would take into account in assessing the appropriate stance for monetary policy,” he said.
Atlanta Fed President Rafael Bostic also noted the Fed may have to cut rates if consumer spending suffers near term.
“The central bank might have to cut interest rates if consumer spending suffers as a result of the new round of tariffs placed on Chinese goods overnight.”
Given the past errors, I would think the Fed should err on the side of caution, by recognizing its past errors and aligning itself with what has proven more accurate in recent past, the market. When the market demands a rate action, it almost always gets it, and when it doesn’t we saw the consequences in financial markets and conditions last year. Should the market not receive the priced in and desired rate cut this go around, the same situation will likely present itself and once again find the Fed in error and forcibly cutting rates. As such, why even travel down that road as a central bank?
Fund Flows Still Stink
For the third week in four, equity ETFs witnessed net outflows, handing back a little less than $3.2 billion for the most recent fund-flows week. Authorized participants (APs) were net redeemers of domestic equity ETFs (-$2.5 billion), also for the third week in four. Meanwhile, non-domestic equity ETFs also witnessed net outflows for the third consecutive week, handing back $667 million this past week. Technology Select Sector SPDR ETF (XLK, +$719 million) and iShares Core MSCI EAFE ETF (IEFA, +$534 million) attracted the largest amounts of net new money of all individual equity ETFs. At the other end of the spectrum, SPDR S&P 500 ETF (SPY, -$1.6 billion) experienced the largest individual net redemptions and Health Care Select Sector SPDR ETF (XLV, -$923 million) suffered the second largest net redemptions of the week.
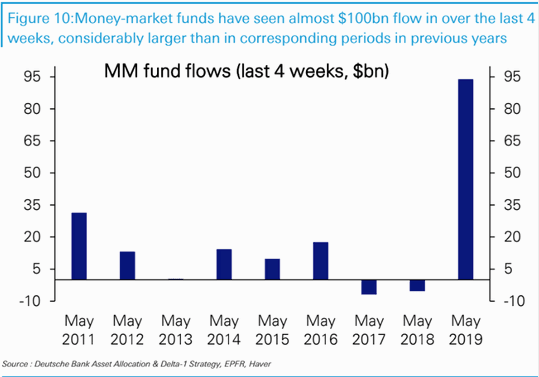
Additionally and over the last 4 weeks, money-market funds have seen a significant inflow of nearly $95 billion. That’s much larger than in previous years as equity investors continue to flee the market in favor of safe haven assets and cash.
U.S. corporate debt markets have slumped this week amid concerns about global trade. Risk premiums on investment-grade bonds have widened about 7 basis points in the last week to 1.26 percentage points on Wednesday. High-yield debt lost 0.53% in the same period, according to Bloomberg Barclays index data. Exchange-traded funds have also suffered hefty outflows as stock and oil markets retreated.
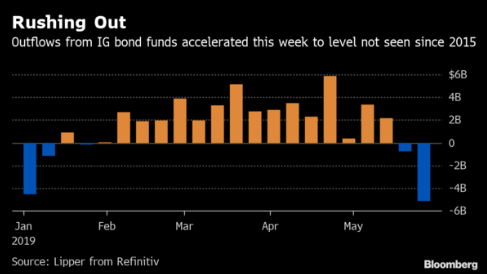
“Outflows are not surprising considering the general move in risk assets, but new issue has slowed a bit and investors have ample cash so it is not overly concerning,” said Bradley Rogoff, global head of credit strategy at Barclays Plc.
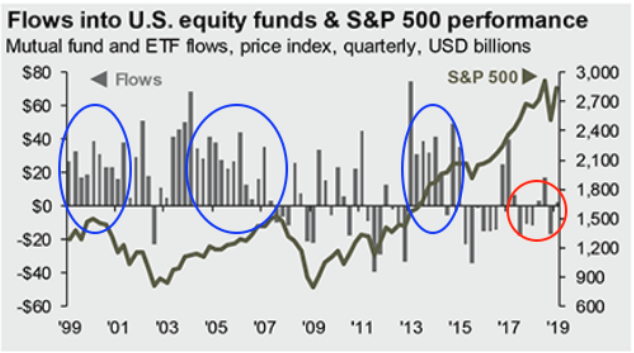
Fund flows into equity mutual funds and ETFs was strong before both the 2000-02 and 2007-09 bear markets, and even before the 2015-16 mini-bear market (blue circles). In comparison, fund flows have been negative for 4 of the past 6 quarters (red circle; from JPM). It’s hard to believe that the market top is in given precedence in the fund flows data.
Economic Data
The economic data releases in the past week were rather mixed, some good and some not as good. For the good…
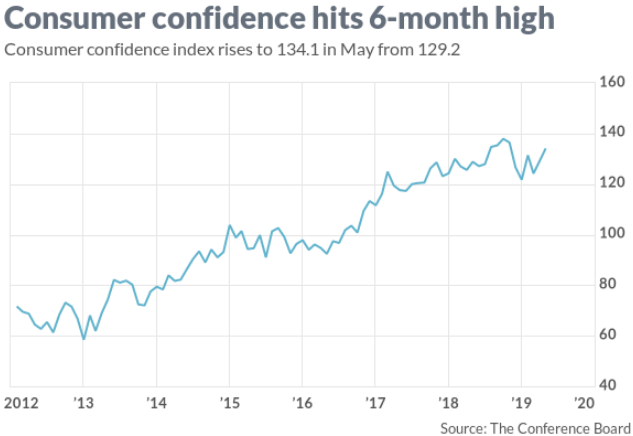
- The consumer confidence index climbed to 134.1 from 129.2 in April, the Conference Board said Tuesday. This was a 6-month high.
- Q1 GDP was only revised down a tenth of a percent from 3.2% to 3.1%.
- Weekly Initial Jobless Claims only rose 3,000 to 215,000, as expected.
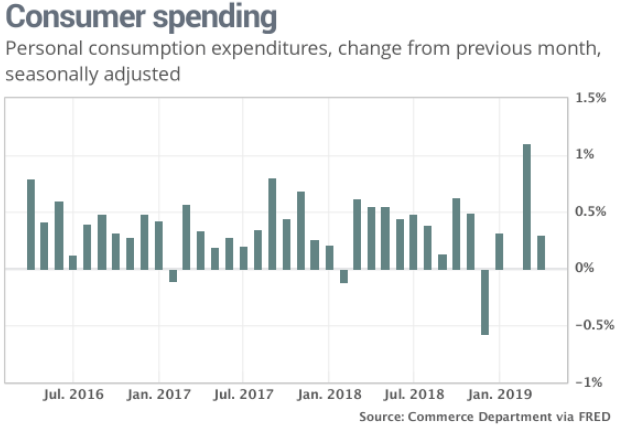
- Consumer spending rose 0.3% last month, the government said Friday, a tick above the MarketWatch forec
- ast. Outlays had surged by a revised 1.1% in March to mark the biggest increase in 10 years, so some letup was expected.
- Incomes rose 0.5% in April — the largest gain in four months. Incomes are rising at the fastest pace since the end of the Great Recession.
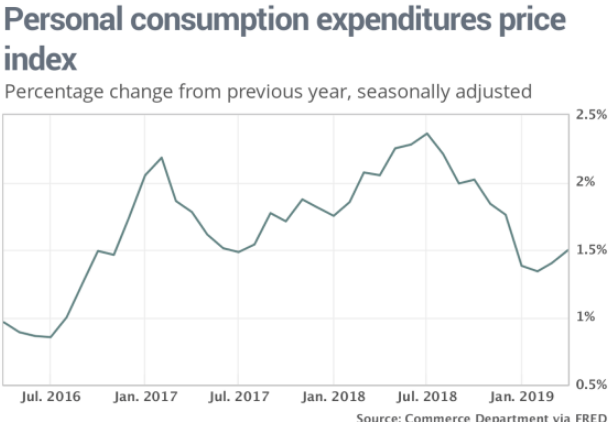
- The PCE index climbed 0.3%, or 0.2% when food and energy are stripped out.
- The rate of inflation over the past year rose a notch to 1.5%. While that’s the highest level since December, it’s still well below the Federal Reserve’s 2% target. The core rate advanced at a 1.6% yearly pace, a tick higher than in March.
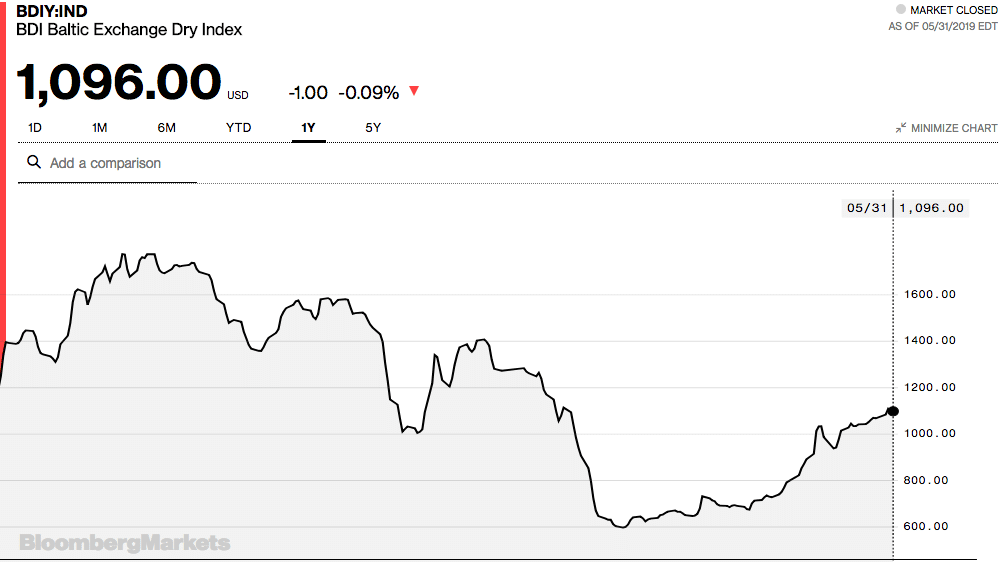
In addition to the bullet points noted, the Baltic Dry Index (BDI) continued to rise through May and despite the escalating trade feuds.
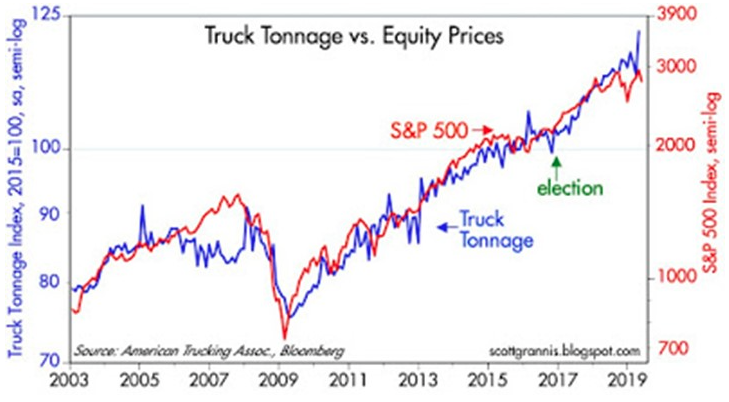
Secondarily, another economic metric that focuses on the strength of goods being transported continues to rally in 2019, trucking tonnage. Truck tonnage is bullish reports Scott Grannis.
The not so good side of the economic data came by way of a decline in Pending Home sales and the latest Chicago PMI, which rose, but only a bit to 54.2 from 52.6 in April. The index had been as high as 64.7 just three months ago.
Moreover, the latest economic data for April is just that, for April and prior to developing trade conflicts that may prove to further weaken economic growth. To this point, many firms have ratcheted lower their Q2 2019 GDP expectations.
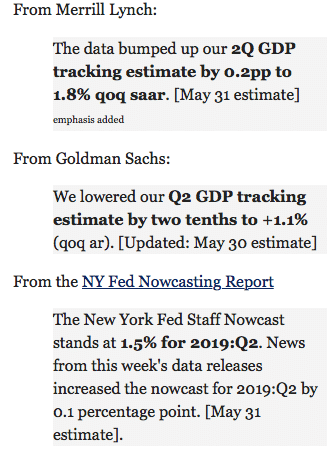
J.P. Morgan economists said they now see much slower second-quarter growth of just 1%, down from their prior forecast of 2.25% and way off the 3.2% reported in the first quarter.
“The April durable goods report was bad, particularly the details relating to capital goods orders and shipments. Coming on the heels of last week’s crummy April retail sales report, it suggests second quarter activity growth is sharply downshifting from the first quarter pace, ” the economists wrote.
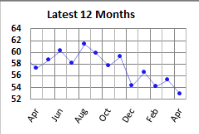
With respect to the economic data and future GDP revisions, the coming week is full of impactful data. Monday will prove to get the weekly economic data calendar moving rapidly to the forefront of investor minds with the release of the ISM manufacturing data for May. (Previous reading indicated in chart below, 52.8)

The index has been under pressure and could tilt the markets even lower if the reading comes in worse than the prior month. You’ll notice from the following 12-month chart, that when the tariffs were implemented against China’s imports in July 2018, the ISM manufacturing index has been on a steady decline.
On Wednesday investors will take a look at the latest ADP private-sector payroll report before the more widely anticipated Nonfarm Payroll report is delivered on Friday. There’s a lot of more relevant data coming out in the week that lay ahead.
Earnings Outlook
The Q1 2019 earnings recession didn’t materialize as feared by many market participants, but Q2 forecasts appear dicey. According to Lipper/Refinitiv, here is how earnings season has rounded out:
Aggregate Estimates and Revisions:
- First quarter earnings are expected to increase 1.5% from 18Q1. Excluding the energy sector, the earnings growth estimate is 2.9%.
- Of the 491 companies in the S&P 500 that have reported earnings to date for 19Q1, 75.2% have reported earnings above analyst expectations. This compares to a long-term average of 65% and prior four-quarter average of 76%.
- 19Q1 revenue is expected to increase 5.6% from 18Q1. Excluding the energy sector, the growth estimate is 6.2%.
- 57.1% of companies have reported 19Q1 revenue above analyst expectations. This compares to a long-term average of 60% and prior four-quarter average of 67%.
- During the week of June 3, five S&P 500 companies are expected to report earnings.
- The estimated earnings growth rate for the S&P 500 for 19Q2 is 0.9%.
According to FactSet, the blended earnings decline for the S&P 500 is -0.4%. If -0.4% is the actual decline for the quarter, it will mark the first year-over-year decline in earnings for the index since Q2 2016 (-3.2%). On March 31, the estimated earnings decline for Q1 2019 was -4.0%. Eight sectors have higher growth rates today (compared to March 31) due to upward revisions to EPS estimates and positive EPS surprises. The blended (year-over-year) revenue growth rate for Q1 2019 is 5.3%. If 5.3% is the final growth rate for the quarter, it will tie the mark the lowest revenue growth rate for the index since Q2 2017 (also 5.3%). The forward 12-month P/E ratio for the S&P 500 is 15.9. This P/E ratio is below the 5-year average (16.5) but above the 10-year average (14.8). Now let’s take a look at FactSet’s Q2 –FY19 forecast below:
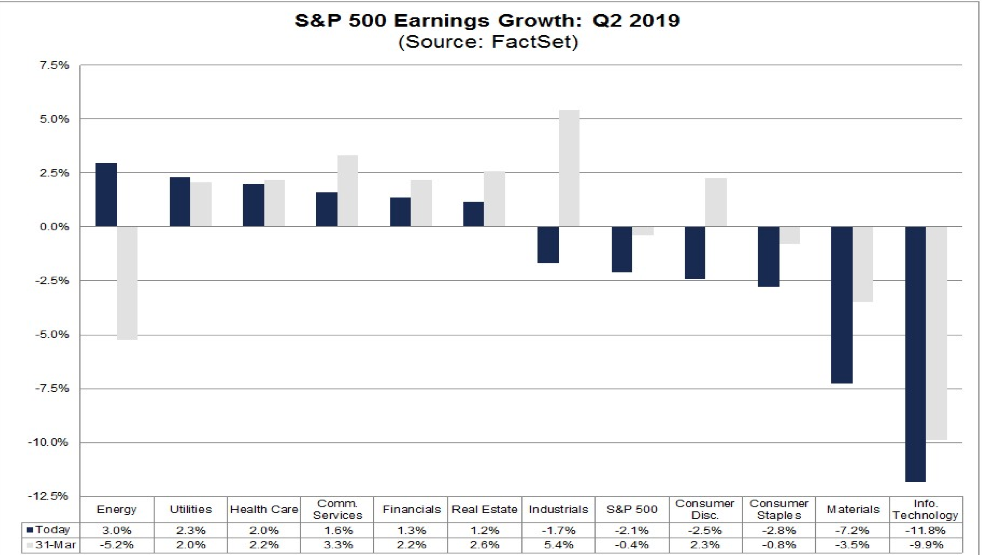
- For Q2 2019, analysts are projecting a decline in earnings of -2.1% and revenue growth of 4.1%.
- For Q3 2019, analysts are projecting earnings growth of 0.3% and revenue growth of 4.2%.
- For Q4 2019, analysts are projecting earnings growth of 7.2% and revenue growth of 4.6%.
- For CY 2019, analysts are projecting earnings growth of 3.2% and revenue growth of 4.6%.
Investor Takeaways
The geopolitical feuding and potential to raise tariffs going forward is the outlier and static variable affecting the global economic and earnings outlook. Try as they may, analysts and strategists are throwing numbers at the wall, assuming a worse situation for the variables that drive equity market over time. The reality is that this is the most unique situation facing the investor, analyst and economist community in quite some time. Nobody can accurately forecast the market or the economy based on the erratic and unforecastable actions of President Donald Trump, not to mention the counteraction taken by adversaries… and maybe that is just the way he likes it.
If we get down to the heart of the economy, while there remain a number of headwinds for future growth, we still expect growth, even with existing tariffs in place. One of the net positives from the Fed pausing rate hikes is that investors have been pricing in what typically comes next after a Fed pause; a rate cut. This has brought rates down significantly over the last 6 months. Interest rate sensitive sectors such as housing have rebounded in 2019 with New Home sales now near cyclical highs. Mortgage applications are also at cycle highs supporting forecasts for future housing market sales to continue their rebound in 2019. Housing sales come with the benefit of add-on consumer spending and retail sales. When a home is bought, stuff is bought to go inside the home; parties are thrown to celebrate new home ownership et cetera.
Housing may have been the sore spot in the economy through 2018, but on the whole, the American housing market is still on solid footing. When we look at delinquency rates… fantastic! Fannie Mae reported that the Single-Family Serious Delinquency rate decreased to 0.72% in April, from 0.74% in March. The serious delinquency rate is down from 1.09% in April 2018.
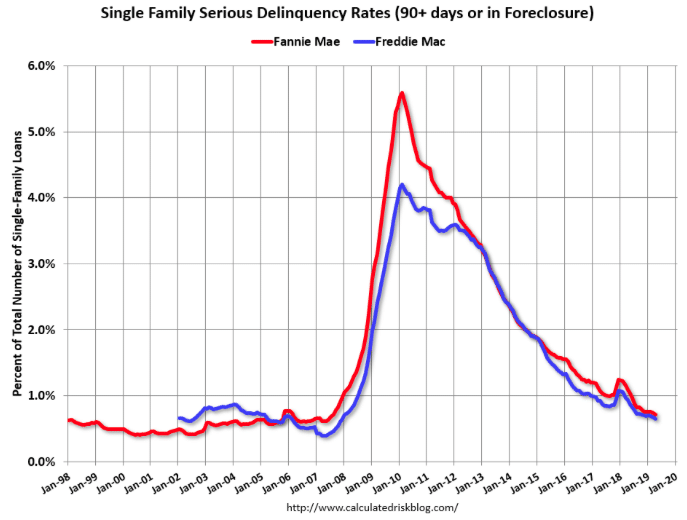
The Fannie Mae serious delinquency rate peaked in February 2010 at 5.59%. This is the lowest serious delinquency rate for Fannie Mae since August 2007.
So while the trade feuds have their cons, they also have ancillary benefits that serve to buffer economic shortcomings elsewhere in the economy. In addition to the lower interest rates, employment and labor markets remain strong in the United States. While global trade has indeed suffered since Q4 2018, domestic demand remains strong with retail sales growing roughly 3% YoY and the service industry remaining strong. Wage growth has been strong since 2018 and has found households with a higher savings rate and better balance sheets. We don’t expect the labor market to suffer from the ongoing trade feud over the next several months (excluding auto sector) and as such a recession is unlikely in 2019.
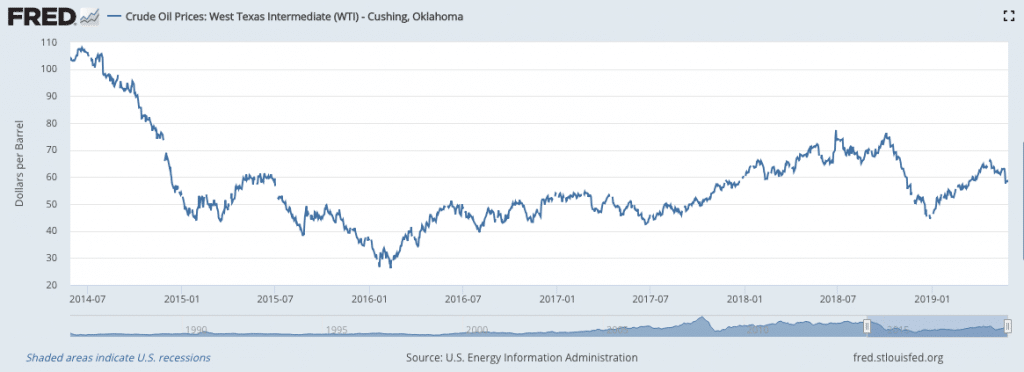
The U.S. economy is still facing turbulence, but investors should focus on the key components that will either help or hinder the S&P 500 EPS outlook for 2019. Oil prices have slid from their April peak and are now some $12 a barrel under their comparative value in 2018. This is a headwind for corporate earnings in the energy sector and for the S&P 500 as a whole.
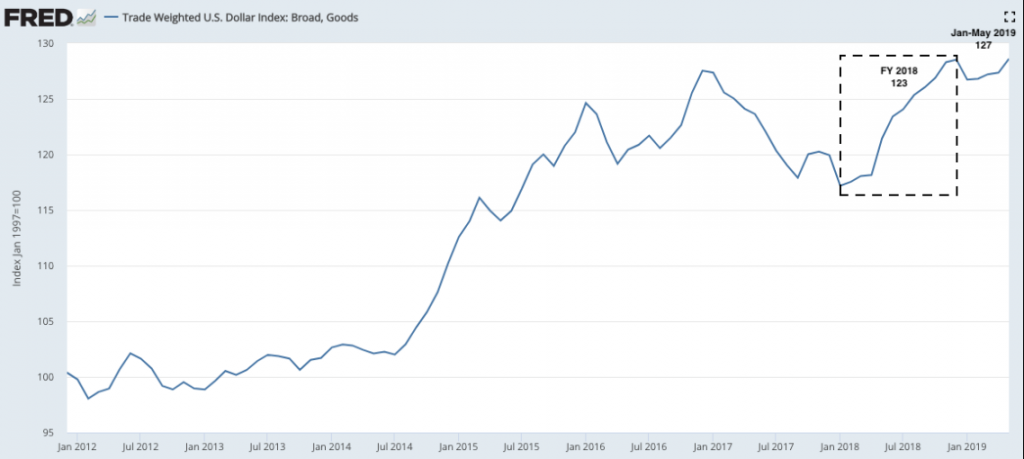
The next issue affecting the EPS and sales outlook in 2019 is the strong U.S. Dollar. Since 2018, the dollar has appreciated by some 9 percent. This has become another headwind. With half of corporate sales coming from abroad, even a small 4% appreciation in the dollar could cut 2 percentage points off sales growth this year.
Last but certainly not least are corporate profit margins! After trending higher over the past 7 years, margins jumped 140bp in 2018. This was a massive rise and sustaining that level is unlikely, especially given the fall in margins over the past 2 quarters.
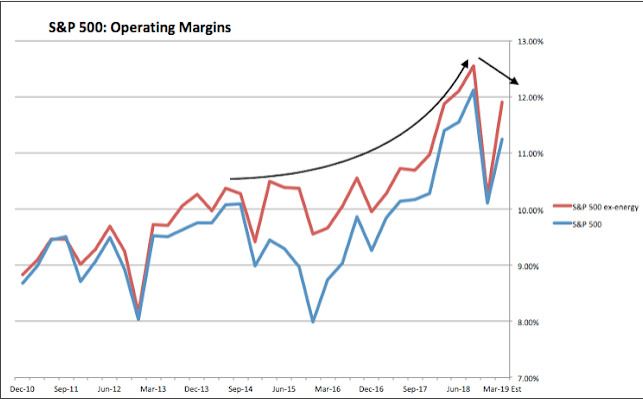
Average margins in 2018 were 11.3%, the same as in 1Q19. If that level is maintained throughout 2019, earnings growth will be 5%, right around the current forecast. If the U.S. Dollar continues to appreciate, that growth could fall to 3% as noted earlier. If oil remains under $65/barrel, earnings may fall. There in lay the recipe for EPS in 2019 and the dominant factors that bear watching. As such, it is no wonder that the S&P 500 and Crude Oil price have tracked each other quite well over the last 6-8 months.
Comments
Log in or sign up to join the conversation.