

While the US economic outlook dramatically worsened over the last few weeks, and will potentially continue to worsen as Initial Jobless Claims rise to over 22 million for the last four weeks as well as US retail sales falling 8.7% (showing the biggest 1-month decline since records began in 1992), Amazon (AMZN) pushed to new all-time highs.
Where do market participants take the optimism from?
What is the secret behinds Amazon's ongoing business success despite an economic crisis?
In our opinion, there were already signs of Amazon coming out strongly from the economic downturn with the expectation that especially small- and mid-sized "competitors" will be forced to shut down their businesses, which will potentially drive even more consumers into the arms of Amazon.
In fact, these signs can already be seen in the Retail Sales data last week. While US Retail Sales dropped, month-to-month, to an all-time low, Non-store Retail Sales rose by more than 3%.
In addition to that, the handling of the "Corona-Shutdown" and the economic downturn is another driver. Amazon's announcement to hire 175,000 more warehouse and delivery workers to keep up with the growing demand shows how strong the business outlook for the 1 trillion market cap company is.
With the economic life returning to normalcy somewhere in the future, Amazon will probably end up retaining customers whose loyalty it gained during the crisis.
How to trade Amazon (AMZN) in this environment?
Despite our long-term bullish outlook for Amazon, we'd be careful to buy into the push to new all-time highs.
In fact, we could imagine the move higher in US-Equities with the Nasdaq100 in fact trading in positive territory as of Friday, April 17, Year-to-Date to stand on a fragile fundament and anther leg lower in US-Equities to have an elevated probability which could also drive the stock of Amazon lower again, probably into the region of 2,000/050 USD per share, a potential mid-term-long trigger.
Technically the mode stays bullish above the SMA(200), probably even as long as we trade above 1,600 USD:
(Click on image to enlarge)
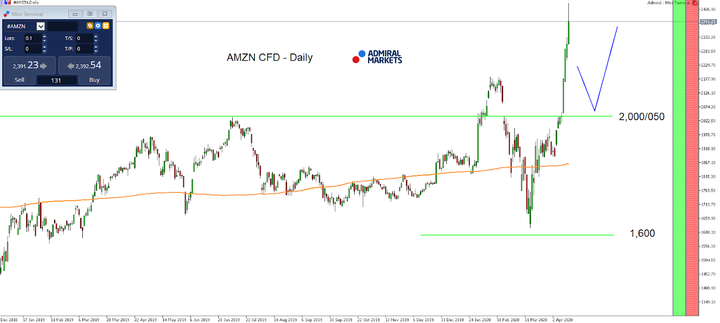
Source: Admiral Markets MT5 with MT5-SE Add-on AMZN CFD Daily chart (between December 24, 2018, to April 17, 2020). Accessed: April 17, 2020, at 12:10pm GMT - Please note: Past performance is not a reliable indicator of future results, or future performance.
In 2015, the value of AMZN increased by 117.78%, in 2016, it rose by 10.95%, in 2017, it increased by 55.96%, in 2018, it rose by 28.43%, in 2019, it increased by 23.03%, meaning that after five years, it was up by 495.4%.



Comments
Log in or sign up to join the conversation.