

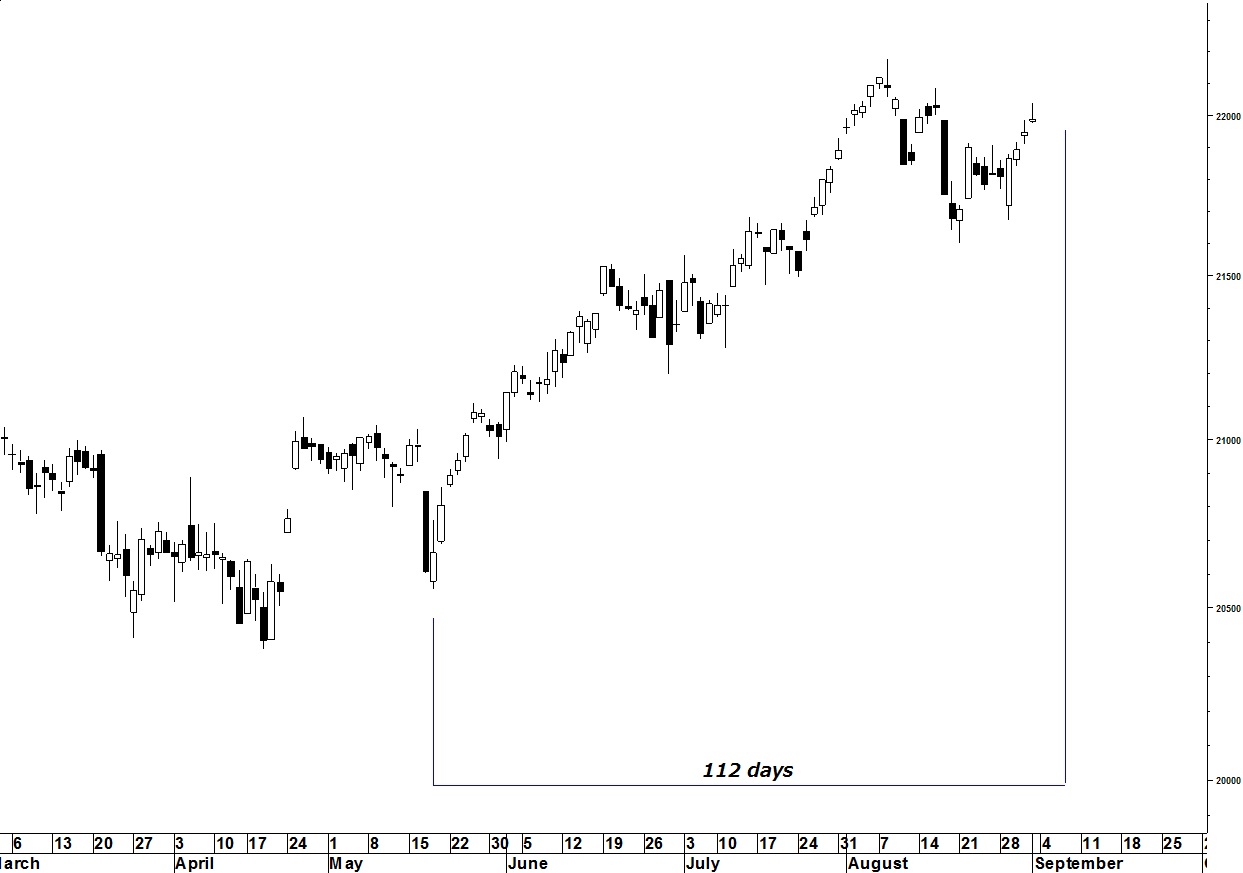
The 93-day cycle low we’ve been following looks to have been successful – at least for the time being – with Wednesday’s intra-day low coming right on-time. However, with a Hybrid forecast for a high on/near 4/3/17, the rally off Wednesday’s low isn’t expected to be sustained.
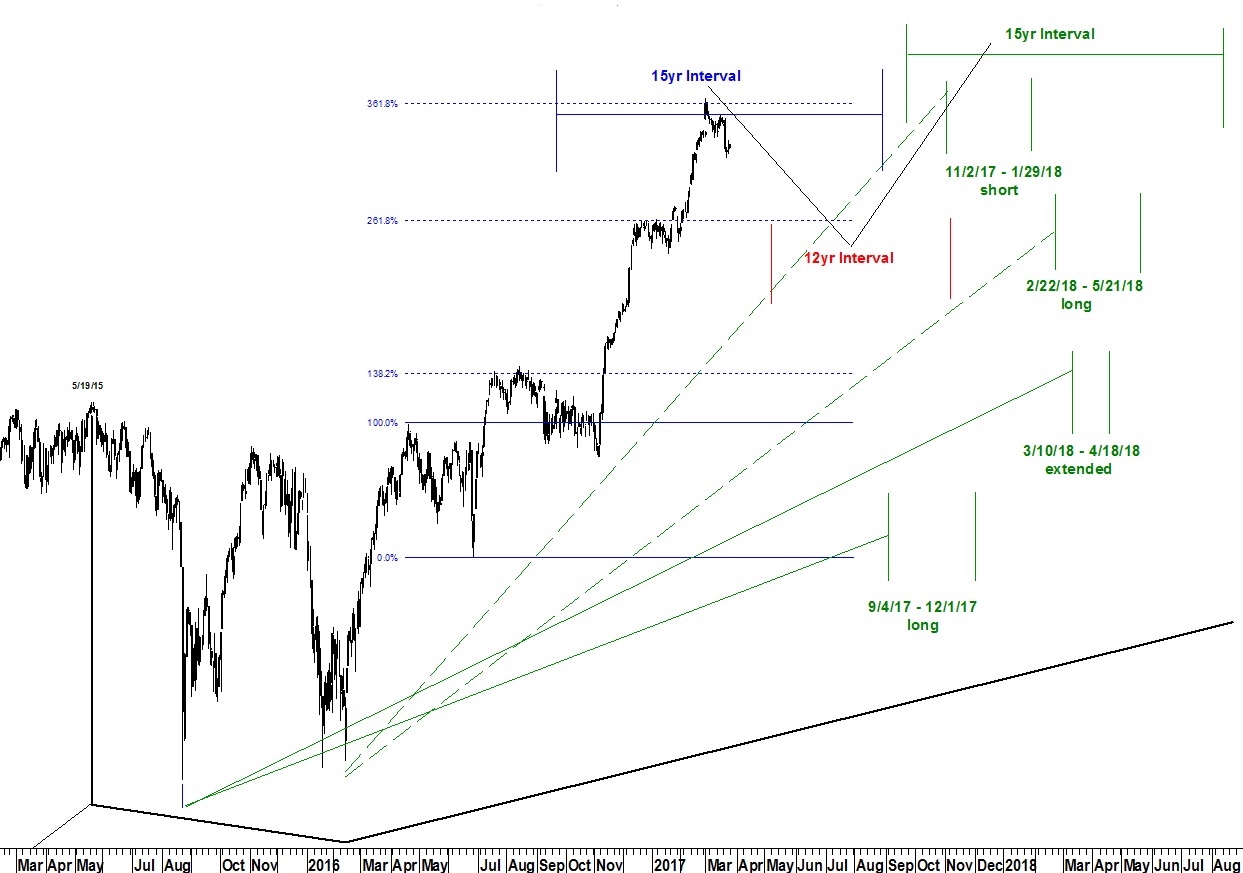
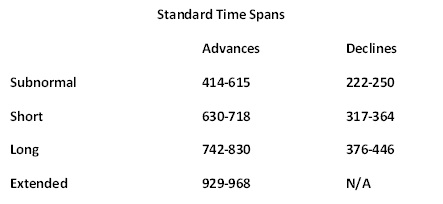
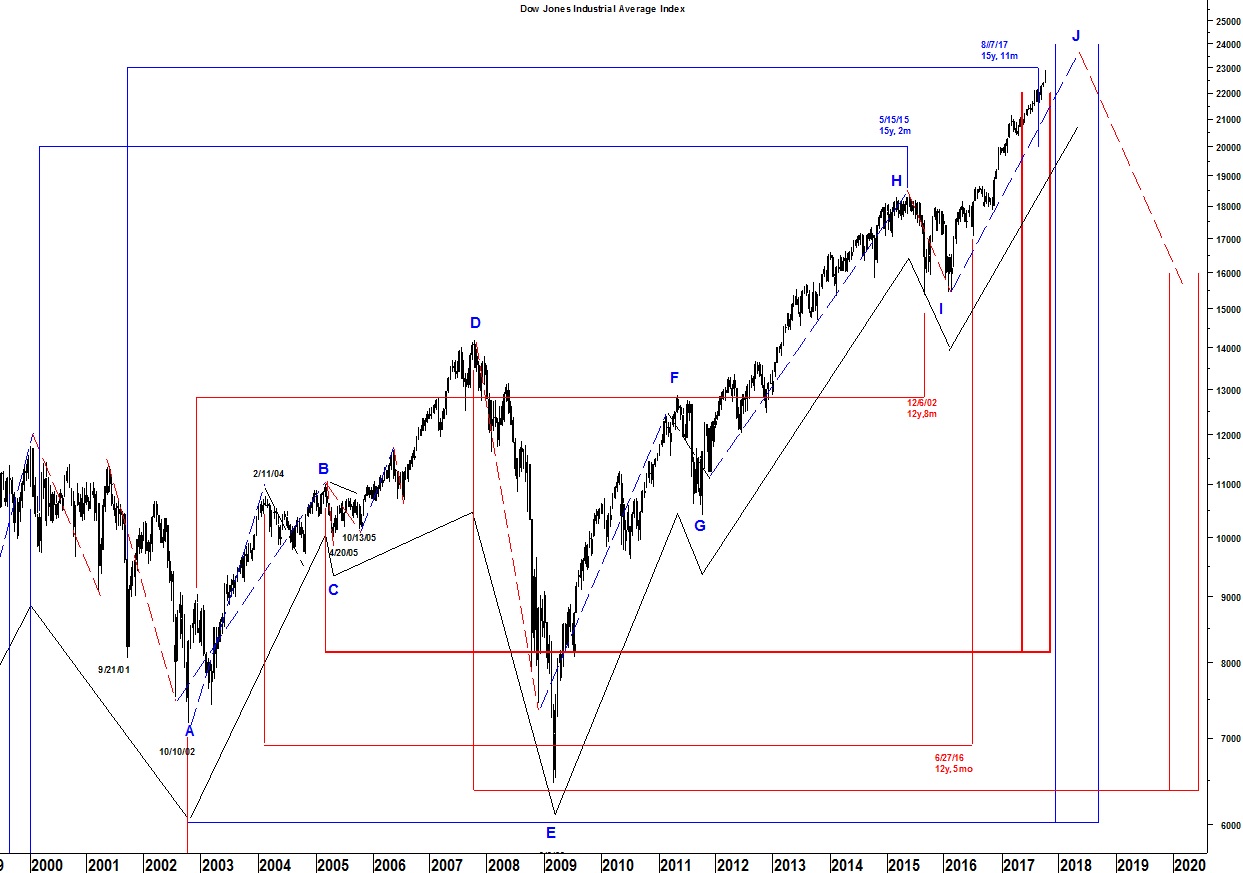
As shown in last week’s Market Update, the long-term intervals forecast a high anytime between now and August. However, they also forecast a low between now and November. As the upcoming high is not expected to be the end of the basic advance (point J) which began at point I of Lindsay’s Long Cycle, we can’t use the standard time spans to try and time this high. We only know that there is a high degree of risk in our immediate future.
The chart below shows the various possibilities for the final basic advance of the 2002 long cycle (secular bull market). We particularly like the overlap of an extended basic advance from 8/24/15 low and a long basic advance from the 2/11/16 low. The overlap occurs in seasonally bearish time of year.
For now, however, we remain focused on the expected decline into the 12yr interval. With every day that goes by it appears more likely that the decline has already begun.
(Click on image to enlarge)

Comments
Log in or sign up to join the conversation.