

The market action of late reminds me of what I experienced in 1987.
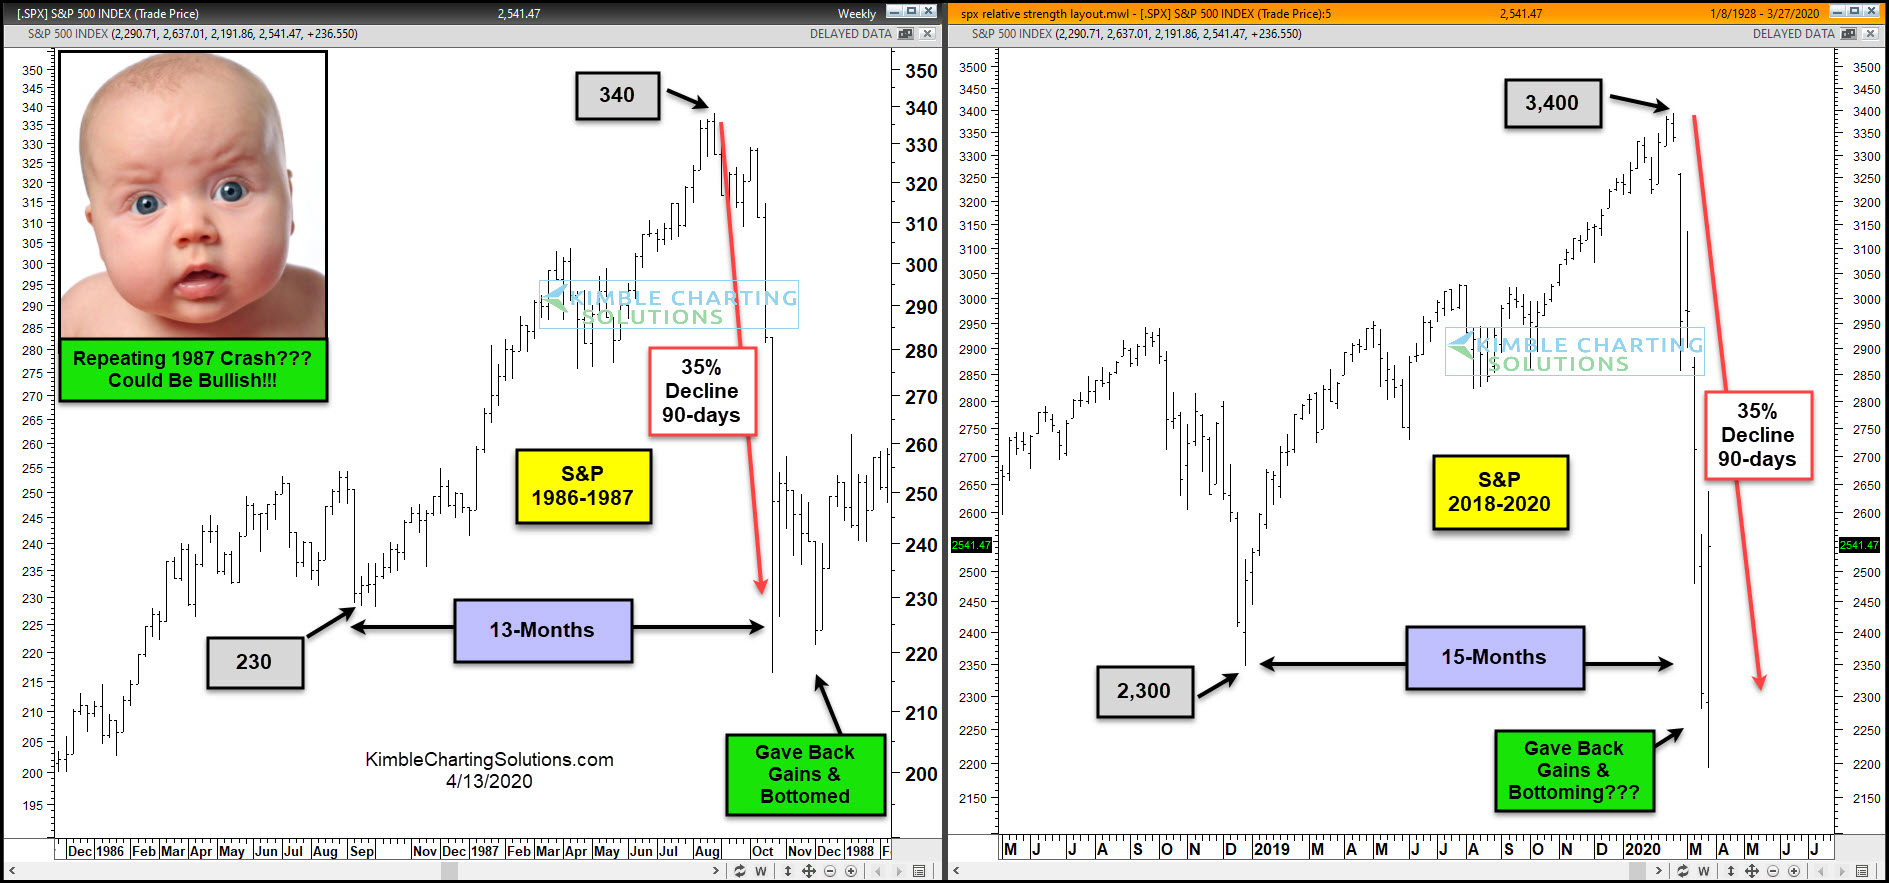
If we are repeating the '87 stock market crash, it could be bullish, as the lows could be in play already.
In today’s 2-pack, I highlight the similarities and what to watch for.
In 1986-1987 (left chart), the S&P 500 rallied from 230 to 340 over 13 months before falling 35 percent. It then rallied sharply before giving back gains and putting in a higher low.
2020 deja vu? You can’t make up the similarities in numbers! During 2018-2020 (right chart), the S&P 500 rallied from 2300 to 3400 over 15 months before falling 35 percent. We have once again rallied sharply.
(Click on image to enlarge)



Comments
Log in or sign up to join the conversation.