U.S. Major Indices: Money Flow And Moving Averages
Further to my post of August 19, the Russell 2000 Index gained the most, in terms of percent, during the past two weeks, as shown on the following graph of the Major Indices for that time period.

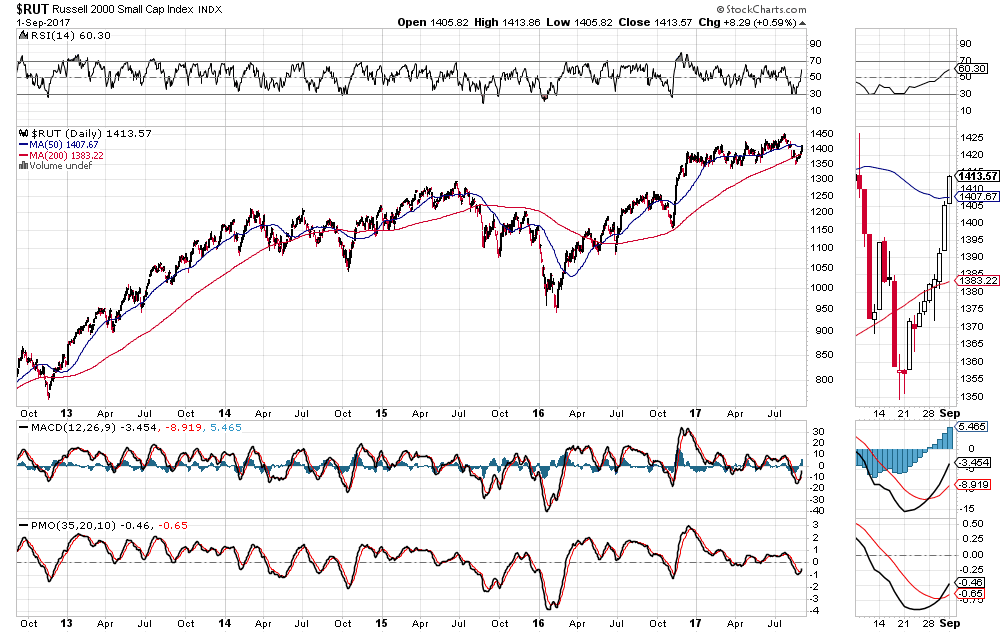
It also rallied and closed above its 50 and 200-day moving averages, as shown on the following Daily chart.

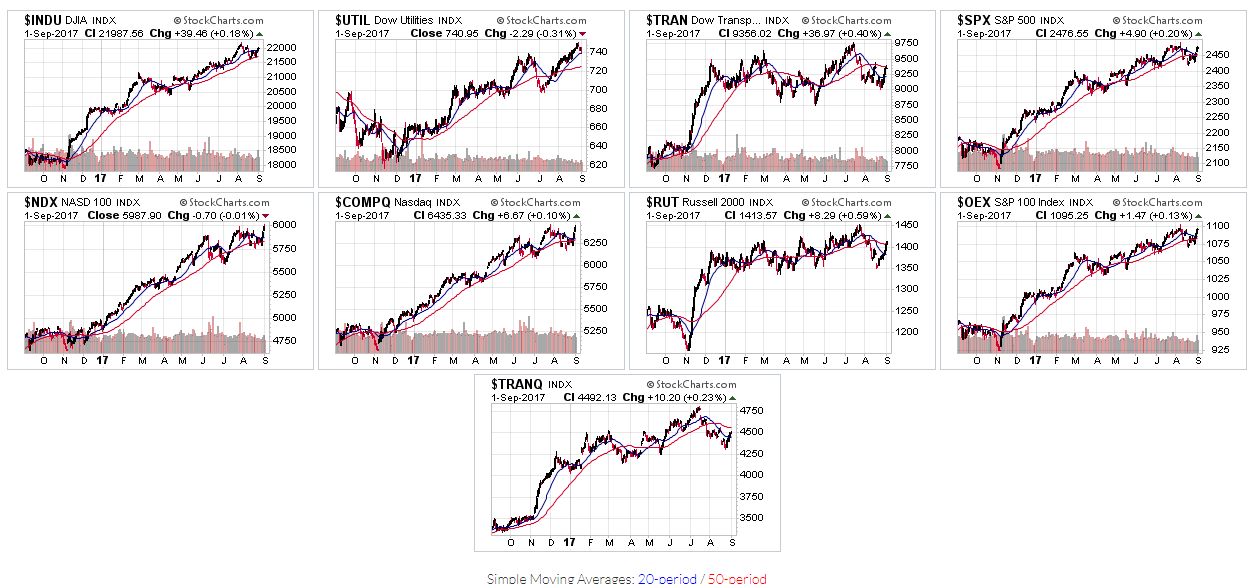
The following 1-Year Daily charts of the Major Indices show the $RUT, $TRAN, $TRANQ have been lagging behind the other indices, so far, this year.

Compared to where the percentages of stocks in those Major Indices were trading above various moving averages two weeks ago (and two weeks prior to that), you can see on the following tables (Source: www.barchart.com) where buyers put their money and propped up stocks above their 50-day moving averages, for example.
The only two indices whose percentages are now higher above their 50 MA than they were one month ago (pre-erosion experienced two weeks ago), are the Dow Utilities and the Nasdaq 100 -- suggesting these may be the two areas to watch for potential strength during the coming days/weeks, along with the Russell 2000 -- in order to hedge against risk-on with less riskier stocks.


We'll see how much risk buyers are willing to add in light of today's (Sunday's) hydrogen bomb test by North Korea, and resultant major (6.3) and smaller (4.1) earthquakes that occurred there...and whether any future larger-scale nuclear activity in NOKO triggers a series of potentially devastating major earthquakes in other countries in the Pacific Rim...and, what about radiation fallout?
At the time of writing this article early Sunday evening, U.S. E-mini Futures Indices are down. GOLD Futures are up and may be taking another run up to, and breakout above, its reverse Head & Shoulders neckline around 1376, as I described in my article of August 28.


Disclaimer: All the information contained within my posts are my opinions only and none of it may be construed as financial or trading advice... please read my full Disclaimer more


