Translating Bonds And ‘Dollars’
More than ten years after Alan Greenspan confessed to not understanding bonds and interest rates, the same assumptions that underpinned Greenspan’s “conundrum” remain as convention. If the Fed raises the federal funds rate by target or by corridor, then all rates should rise. It is believed to be just that simple, a fact (the belief) further established this week by media narrative and the “expert” commentary that guides it.
That view, however, confuses the moment of decision. It presupposes infallibility which has been proven not to exist. Presumably the Fed’s “hawkishness” derives from its proficiency in economic interpretation. Therefore, bond rates would rise not based on monetary policy action per se, but rather agreeing with the Fed’s interpretation of what “hawkishness” means as far as economic opportunity. To claim that the bond market must follow monetary policy is to simultaneously claim that the FOMC is always right; and further that bonds must always defer in that judgment to these economists.
The bond market does not do this, though it does take into consideration central bank judgment as part of its stream of information. Before the summer of 2011, the bond market largely agreed with FOMC assessments. By and large, though, ever since 2011 the bond market which is always free to disagree with them about the economy or even the state of monetary function has exercised that freedom and in convincing fashion. From 2013 forward, nominal rates should have risen and curves steepened as economists and policymakers declared QE3 a resounding success, with particular emphasis on the unemployment rate. The bond market was correct, not economists.
What drives UST yields or eurodollar futures prices is therefore not “hawkishness” or “dovishness”, but rather perceptions about whether “hawkishness”, “dovishness”, Trump, or even Paul Krugman’s fake alien invasion scenario will amount to anything positive and the significance of it. It is the translation of current conditions into considerations about the future, captured in prices and yields – the actual discounting of information, of which monetary policy is only a (variable) part.
Again, since 2011, the allocation of the discounting to monetary policy and monetary policy figures has been dramatically scaled back. The primary reason beyond the economy is purely monetary – the current state of “dollars” as defined by all the ways in which bank reserves are not money. As noted yesterday, swap spreads define one channel by which we can interpret that actual state of bank balance sheet capacity outside of the convention where bank reserves are improperly assigned as “base money.” Using the history of swap spreads along with that of the UST curve we can decompose financial behavior into these two pertinent constituent pieces and then deduce, rather than continue to blindly speculate about, the actual role of the Fed in them.
(Click on image to enlarge)
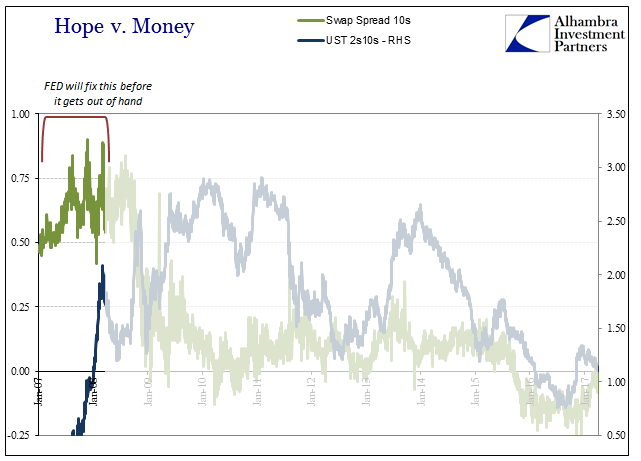
From an inverted state entering 2007 (the “conundrum”), the UST curve steepened dramatically as the treasury market began to suspect looming “dovishness” in the form of sharply falling short-term rates. The steepness of the curve, meaning long rates did not descend nearly as far as short rates, indicated that by and large the treasury market fully expected the Fed would fix these “shadow” problems long before they got out of hand. After all, the central bank was at the time still given enormous leeway due to assumptions and myth.
The relatively steep swap curve and positive swap spread (the swap price, the fixed leg yield, as compared to the same maturity UST yield) hinted that in terms of current conditions the rising monetary problems while serious had not to that point inhibited full systemic function, meaning a full and lasting systemic break.
(Click on image to enlarge)
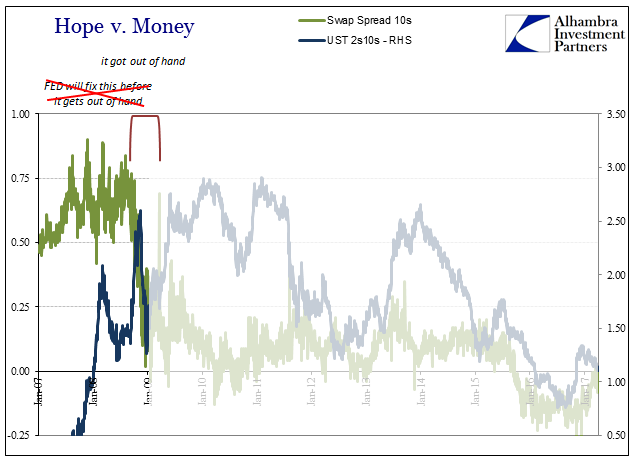
By July and August 2008, all that changed and whatever the Fed had done up to that point, which was considerable if ultimately futile, had failed to contain monetary destruction. As swap spreads fell sharply in historic fashion, the yield curve flattened at certain times while nominal rates dropped. Pessimism in the short run “dollar” was matched by yield curve doubt.
(Click on image to enlarge)
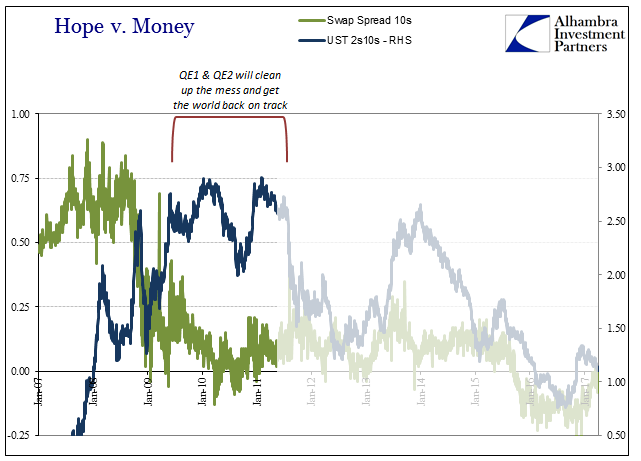
What followed were ZIRP and QE, which the UST market interpreted at first as meaningful changes to monetary policy. Whereas what was done before in terms of liquidity had proven ineffective, surely “money printing” would not be. Note, however, that swap spreads stayed down throughout, which tells us that actual present monetary conditions were never positively affected by QE. The difference between swap spreads and the treasury curve is as I proposed above – UST’s were pricing confidently that though QE hadn’t actually fixed the current “dollar” condition it would at some point in the future.
(Click on image to enlarge)
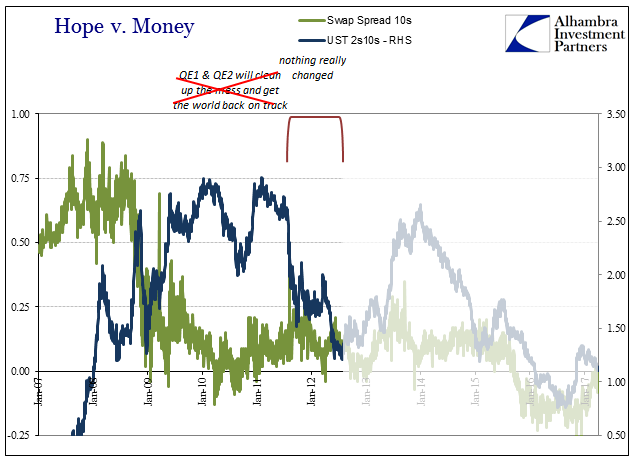
In the summer of 2011, however, the UST curve rejoined swaps in pricing only bleakness; troubling chronic “dollar” problems were at those times being translated by the treasury market into an equally troubling future growth paradigm. It would not be until after QE3 appeared to have been successful, at least in avoiding further economic and financial erosion after 2012, that the UST curve again shifted to a more positive translation of current conditions to more positive future prospects. A relative rise in swap spreads throughout the first eight months of 2013 certainly aided in that view, as many then saw swap prices (as well as other monetary indications) seemingly moving in the right direction as proof the crisis had ended. It was, also noted yesterday, a category error, mistaking relative improvement for categorical change.
(Click on image to enlarge)
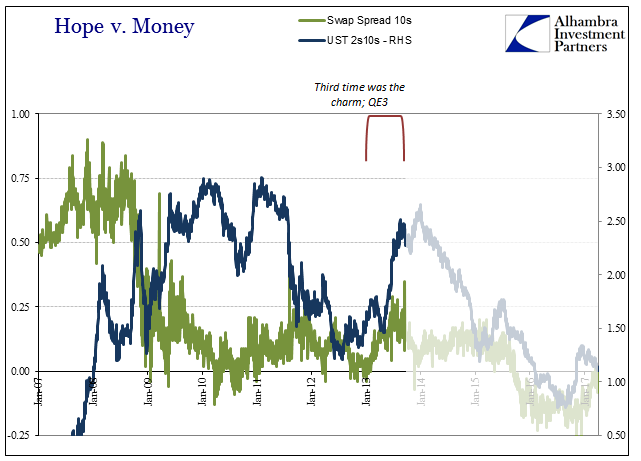
The euphoria was both fleeting and truncated, as a good deal of pessimism had after 2011 been introduced despite all the positive talk in the media and from policymakers. UST markets, as well as others, had taken notice as to how QE3 didn’t actually change much in “dollar” conditions, with the summer of 2013 as strikingly chaotic as 2012. Monetary policy under a third and fourth iteration seemed to be failing in exactly the same way as the first and second – though swap spreads were better, “better” didn’t amount to much.
(Click on image to enlarge)
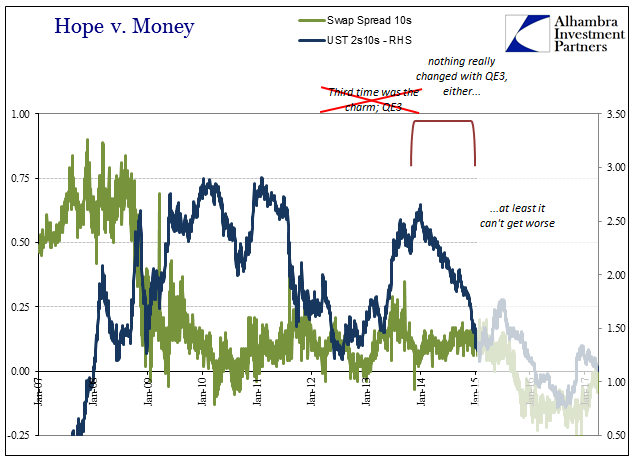
What hope there was in the UST curve to start 2014 was fully dissolved by that year’s end. Both swap spreads as well as the yield curve were in complete agreement that the present remained in a bad way and that the insufferable nature of that position was going to, as it already had, have profound effects on future economic as well as financial opportunity.
(Click on image to enlarge)
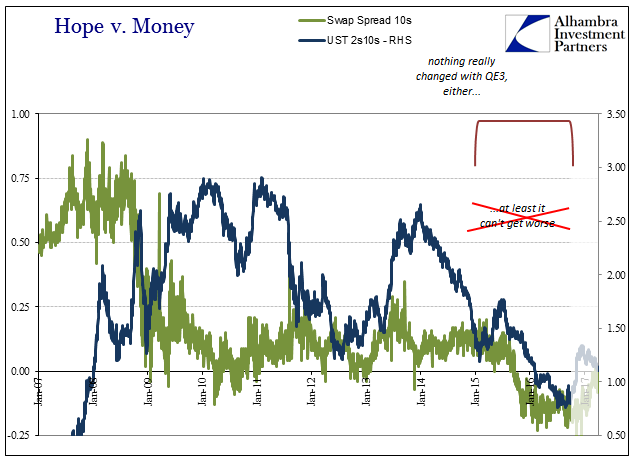
Of course, at that point it all deteriorated further in every way possible – economy as well as “dollar.” Having moved through this “rising dollar” period, now on the other side of it we are back with all the mainstream rhetoric about positivity that isn’t matched by either of these indications (or the many others).
(Click on image to enlarge)
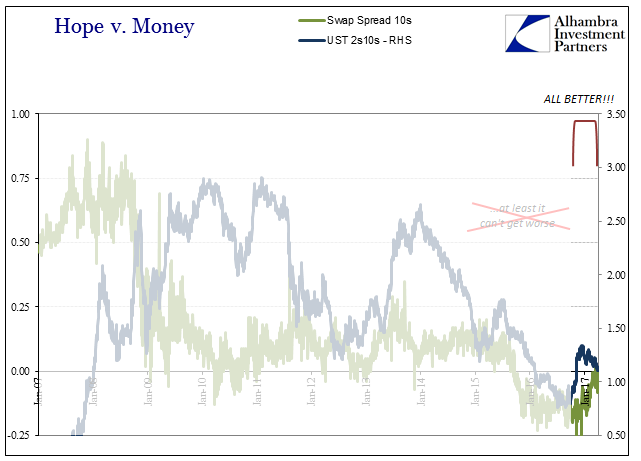
Swap spreads as well as the UST curve show us exactly the same thing – current conditions remain abnormally “tight” which will continue to severely constrain opportunity well into the foreseeable future.
(Click on image to enlarge)
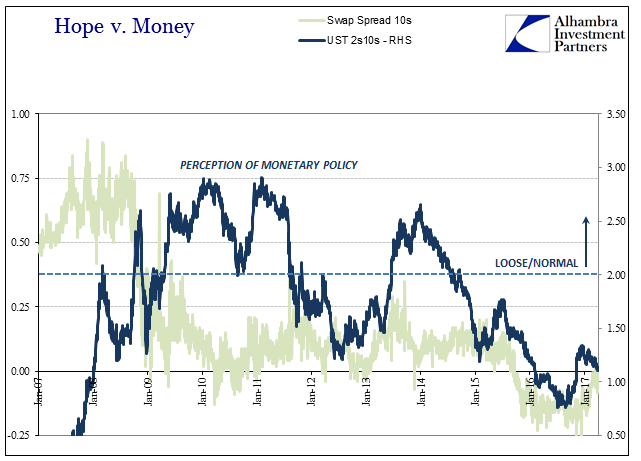
Thus, yields and curve spreads are not related directly to “dovish” or “hawkish” sentiments but rather the market’s view of ultimately what monetary policy might accomplish in either setting (or in the current state of RHINO’s, no longer even try to). The UST market though monetary experience simply no longer pays as much attention to the FOMC as the media, and has been proven correct for doing so. The reason continues to be how despite all the so-called money printing of QE’s and balance sheet expansions in other forms, none of it is or was actually useful money (bank reserves are but one small, unimportant form of bank liability).
(Click on image to enlarge)
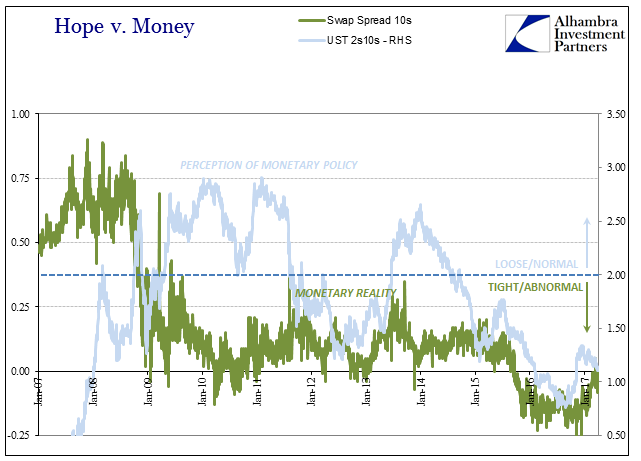
Where the UST curve especially before the summer of 2011 was projecting monetary policy would lead to loose and normal monetary and therefore economic conditions, it no longer does so because functional monetary reality was uniformly constrained no matter what QE – and then got even worse under the full weight of the “rising dollar” (felt by so much more than IRS).
As compelling as this narrative is on its own, it is further stood up by both economic history, especially the lack of any recovery now admitted, quietly, by policymakers as well as economic statistics, as well as the corroboration of other monetary channels. We can swap (pardon the pun) eurodollar futures for the UST curve and see almost exactly the same story unfold.
(Click on image to enlarge)
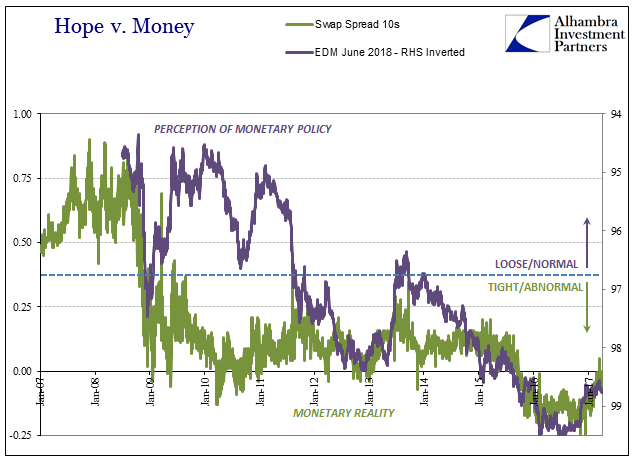
The only real difference is that eurodollar futures, which are an even more direct link between monetary policy and the future state of the world as viewed through money rates, were far more realistic about the prospects for monetary policy success after 2011. Apart from just a few months in 2013, eurodollar futures have for the most part been fully pessimistic about both QE failure and what that would mean for the long run.
Bond yields are not a reflection of monetary policy directly, but rather what monetary policy actually means outside of all the rhetoric. In the years since 2011, market perceptions of monetary policy, including related measures like inflation expectations, have come to almost perfectly and consistently match contrary indications of actual “dollar” conditions that still, to this day, suggest there is nothing good about the global money system or the Fed’s role in it.
Disclosure: This material has been distributed fo or informational purposes only. It is the opinion of the author and should not be considered as investment advice or a recommendation of any ...
more


