
Thor Industries: Strong Buy
Forecast and valuation data. They are presented by one-month forecast return. Thor Industries (THO) is the leader here.
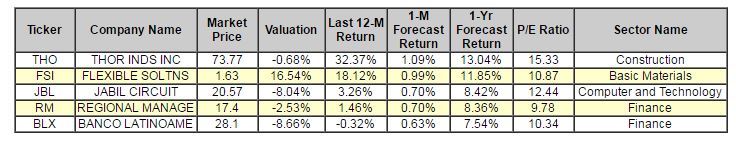
Below is today's data on Thor Industries (THO):
Thor Industries manufactures a wide range of recreational vehicles (RVs) at various manufacturing facilities located in Indiana and Ohio and sold through independent dealers in the U.S. and Canada.
Recommendation: We updated our recommendation from BUY to STRONG BUY for THOR INDS INC on 2016-07-15. Based on the information we have gathered and our resulting research, we feel that THOR INDS INC has the probability to OUTPERFORM average market performance for the next year. The company exhibits ATTRACTIVE Momentum and Sharpe Ratio.
|
ValuEngine Forecast |
||
|
Target |
Expected |
|
|---|---|---|
|
1-Month |
74.57 | 1.09% |
|
3-Month |
75.52 | 2.37% |
|
6-Month |
76.19 | 3.28% |
|
1-Year |
83.39 | 13.04% |
|
2-Year |
78.26 | 6.09% |
|
3-Year |
75.55 | 2.41% |
|
Valuation & Rankings |
|||
|
Valuation |
0.68% undervalued |
Valuation Rank |
|
|
1-M Forecast Return |
1.09% |
1-M Forecast Return Rank |
|
|
12-M Return |
32.37% |
Momentum Rank |
|
|
Sharpe Ratio |
0.60 |
Sharpe Ratio Rank |
|
|
5-Y Avg Annual Return |
16.17% |
5-Y Avg Annual Rtn Rank |
|
|
Volatility |
26.97% |
Volatility Rank |
|
|
Expected EPS Growth |
11.43% |
EPS Growth Rank |
|
|
Market Cap (billions) |
3.94 |
Size Rank |
|
|
Trailing P/E Ratio |
15.33 |
Trailing P/E Rank |
|
|
Forward P/E Ratio |
13.75 |
Forward P/E Ratio Rank |
|
|
PEG Ratio |
1.34 |
PEG Ratio Rank |
|
|
Price/Sales |
0.91 |
Price/Sales Rank |
|
|
Market/Book |
5.31 |
Market/Book Rank |
|
|
Beta |
1.19 |
Beta Rank |
|
|
Alpha |
0.12 |
Alpha Rank |
|
Market Overview
|
Summary of VE Stock Universe |
|
|
Stocks Undervalued |
53.96% |
|
Stocks Overvalued |
46.04% |
|
Stocks Undervalued by 20% |
23.51% |
|
Stocks Overvalued by 20% |
15.53% |
Sector Overview
|
Sector |
Change |
MTD |
YTD |
Valuation |
Last 12-MReturn |
P/E Ratio |
|
Basic Materials |
0.38% |
8.34% |
50.83% |
18.38% overvalued |
43.79% |
31.45 |
|
Consumer Staples |
0.18% |
2.53% |
9.98% |
8.45% overvalued |
4.94% |
24.47 |
|
Utilities |
0.33% |
3.42% |
14.58% |
7.24% overvalued |
9.04% |
23.54 |
|
Multi-Sector Conglomerates |
0.29% |
2.21% |
6.68% |
6.40% overvalued |
-3.15% |
18.86 |
|
Industrial Products |
0.37% |
4.82% |
10.37% |
2.34% overvalued |
-1.26% |
22.60 |
|
Business Services |
-0.09% |
3.26% |
14.10% |
0.07% overvalued |
-7.10% |
23.53 |
|
Construction |
0.25% |
4.27% |
25.33% |
0.24% undervalued |
2.63% |
22.09 |
|
Oils-Energy |
-0.29% |
1.13% |
17.56% |
1.23% undervalued |
-23.09% |
23.56 |
|
Aerospace |
-0.24% |
2.40% |
-2.65% |
1.65% undervalued |
-4.50% |
19.12 |
|
Finance |
0.13% |
3.03% |
4.35% |
2.06% undervalued |
-2.36% |
16.24 |
|
Computer and Technology |
0.06% |
3.60% |
9.34% |
2.23% undervalued |
-2.36% |
29.56 |
|
Consumer Discretionary |
0.07% |
4.07% |
6.52% |
2.84% undervalued |
-7.34% |
21.79 |
|
Transportation |
-0.01% |
6.35% |
6.94% |
8.47% undervalued |
-24.11% |
14.18 |
|
Retail-Wholesale |
-0.43% |
2.78% |
-0.70% |
9.36% undervalued |
-11.16% |
21.97 |
|
Medical |
0.06% |
4.46% |
0.42% |
9.83% undervalued |
-22.75% |
27.62 |
|
Auto-Tires-Trucks |
0.71% |
4.36% |
-1.23% |
16.78% undervalued |
-11.79% |
12.46 |
Disclosure: None.
Disclaimer: ValuEngine.com is an independent research provider, producing buy/hold/sell recommendations, ...
more

