This Week's Top Upgrade: NGL Energy Partners
NGL Energy Partners LP (NGL) is our top-rated upgrade this week and it is a STRONG BUY--as are FBP and MTOR. The rest of the components on our list are BUY-rated companies.

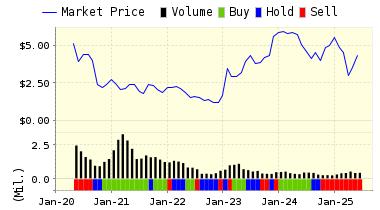
Below is today's data on NGL Energy Partners LP (NGL):
NGL Energy Partners LP is a limited partnership operating a vertically-integrated propane business with three operating segments: retail propane; wholesale supply and marketing; and midstream. The Retail Propane segment engages in retail marketing, sale, and distribution of propane, including the sale and lease of propane tanks, equipment, and supplies to residential, agricultural, commercial, and industrial customers through customer service locations. The Wholesale Supply and Marketing segment supplies propane and other natural gas liquids, as well as provides related storage to retailers, wholesalers, and refiners. The Midstream segment involves in the delivery of propane from pipelines or trucks to propane terminals and transfers the propane to third-party transport trucks for delivery to retailers, wholesalers, or other consumers. NGL Energy Partners LP is headquartered in Tulsa, Oklahoma.
Recommendation: We updated our recommendation from BUY to STRONG BUY for NGL Energy Partners on 2016-12-02. Based on the information we have gathered and our resulting research, we feel that NGL Energy Partners has the probability to OUTPERFORM average market performance for the next year. The company exhibits ATTRACTIVE Price Sales Ratio and P/E Ratio.

|
ValuEngine Forecast |
||
|
Target |
Expected |
|
|---|---|---|
|
1-Month |
18.47 | 1.19% |
|
3-Month |
18.39 | 0.79% |
|
6-Month |
18.39 | 0.77% |
|
1-Year |
20.86 | 14.33% |
|
2-Year |
16.29 | -10.74% |
|
3-Year |
12.56 | -31.16% |
|
Valuation & Rankings |
|||
|
Valuation |
25.14% undervalued |
Valuation Rank |
|
|
1-M Forecast Return |
1.19% |
1-M Forecast Return Rank |
|
|
12-M Return |
20.14% |
Momentum Rank |
|
|
Sharpe Ratio |
-0.07 |
Sharpe Ratio Rank |
|
|
5-Y Avg Annual Return |
-3.06% |
5-Y Avg Annual Rtn Rank |
|
|
Volatility |
46.82% |
Volatility Rank |
|
|
Expected EPS Growth |
-29.39% |
EPS Growth Rank |
|
|
Market Cap (billions) |
1.63 |
Size Rank |
|
|
Trailing P/E Ratio |
10.80 |
Trailing P/E Rank |
|
|
Forward P/E Ratio |
15.29 |
Forward P/E Ratio Rank |
|
|
PEG Ratio |
n/a |
PEG Ratio Rank |
|
|
Price/Sales |
0.15 |
Price/Sales Rank |
|
|
Market/Book |
0.81 |
Market/Book Rank |
|
|
Beta |
0.46 |
Beta Rank |
|
|
Alpha |
0.03 |
Alpha Rank |
|
Market Overview
|
Summary of VE Stock Universe |
|
|
Stocks Undervalued |
38.2% |
|
Stocks Overvalued |
61.8% |
|
Stocks Undervalued by 20% |
16.83% |
|
Stocks Overvalued by 20% |
28.78% |
Sector Overview
|
Sector |
Change |
MTD |
YTD |
Valuation |
Last 12-MReturn |
P/E Ratio |
|
Industrial Products |
0.28% |
0.16% |
24.69% |
20.88% overvalued |
16.40% |
23.48 |
|
Multi-Sector Conglomerates |
-0.15% |
0.67% |
11.15% |
19.39% overvalued |
5.56% |
19.09 |
|
Aerospace |
0.17% |
-0.17% |
13.36% |
17.32% overvalued |
8.43% |
20.05 |
|
Oils-Energy |
0.38% |
0.60% |
29.08% |
15.58% overvalued |
10.16% |
25.76 |
|
Basic Materials |
0.44% |
0.52% |
55.33% |
13.79% overvalued |
60.39% |
27.23 |
|
Construction |
-0.13% |
-0.09% |
33.46% |
11.19% overvalued |
14.24% |
20.10 |
|
Finance |
-0.19% |
-0.20% |
13.29% |
11.09% overvalued |
6.90% |
17.41 |
|
Transportation |
0.03% |
0.29% |
18.65% |
10.33% overvalued |
2.84% |
18.27 |
|
Business Services |
-0.17% |
-0.62% |
21.36% |
7.49% overvalued |
-0.34% |
23.68 |
|
Computer and Technology |
0.14% |
-1.51% |
18.25% |
7.44% overvalued |
4.58% |
29.14 |
|
Retail-Wholesale |
-0.15% |
-0.58% |
1.87% |
6.71% overvalued |
2.49% |
23.53 |
|
Utilities |
0.03% |
-0.30% |
12.67% |
5.27% overvalued |
13.18% |
21.62 |
|
Consumer Discretionary |
-0.43% |
-0.78% |
9.07% |
4.72% overvalued |
6.63% |
23.00 |
|
Auto-Tires-Trucks |
-0.84% |
-0.12% |
10.68% |
3.88% overvalued |
12.88% |
14.38 |
|
Consumer Staples |
0.42% |
-0.56% |
6.71% |
1.50% overvalued |
2.92% |
23.47 |
|
Medical |
0.53% |
-0.75% |
-2.12% |
6.61% undervalued |
-12.99% |
27.31 |
Valuation Watch: Overvalued stocks now make up 61.8% of our stocks assigned a valuation and 28.78% of those equities are calculated to be overvalued by 20% or more. Fifteen sectors are calculated to be overvalued.
Disclaimer: ValuEngine.com is an independent research ...
more


