They Changed GDP, At Least
This is one of those time where so much has happened that in the end, it amounts to so very little. The latest GDP estimates included a sharp rise in the current estimates, a reworking of past estimates that seemed to have made the economy much richer, but behind all that the same economic picture as before.
As most people expected outside of politics, quarterly growth in Q2 was boosted by a single item. Coming in at 4.1%, or, more appropriately, 3.98008% continuously compounded annual, this was by far the best number since Q3 2014.
It was boosted by a noticeably outsized contribution from the export sector.
(Click on image to enlarge)
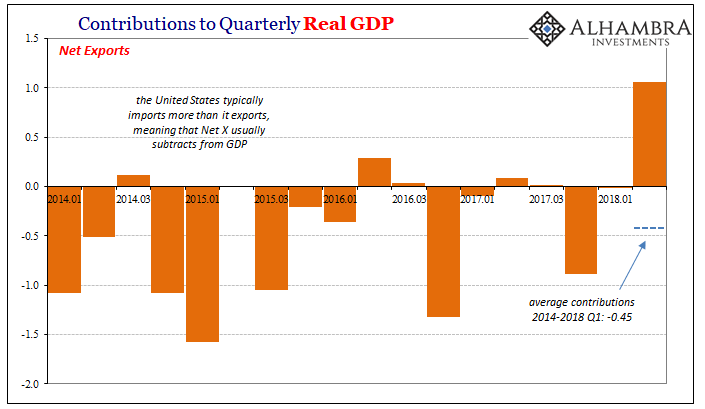
We’ve been hearing about trade wars and restrictions on goods all year. In Q2, US exporters took their turn trying to get ahead of them. Net Exports, a category which includes imports subtract against exports, is usually a drag on GDP since the United States almost always brings in more goods than it ships out.
From 2014 through Q1 2018, the average contribution of Net X to quarterly GDP was -0.45 points. In Q2, contrarily, Net X added a stout +1.06. The difference, about 1.5 points, pulled off of Q2’s 4.1% suggests a less distorted number around 2.6%. Sounds about right.
There were other potential one-time contributions, too, in segments like autos but those aren’t so obvious and clean as it is in the trade sector.
The biggest problem with the boom narrative is actually found in another part of the GDP aggregate. Businesses, quite literally, aren’t buying it. If they were turning as optimistic as Economists and central bankers (same thing) have been (but not banks even though bank Economists are acting like Economists), then we would expect a surge in inventory. It’s not there. In fact, in Q2 2018, inventories sunk again, subtracting 1 full point off this quarter’s figure.
(Click on image to enlarge)

This is totally unlike 2014, the last time there was a similar growth estimate as well as the last time the economy was on an upswing. Four years ago, American businesses really believed in the rhetoric about how the economy was going to take off in 2015. They stocked up in historic fashion – just before sales dropped off which in some industries was precipitous.
Now two full years on from the trough of the 2015-16 downturn, it appears they aren’t so willing to be burnt again by Economists. The slowdown in inventory accumulation parallels very closely the slowdown in labor markets, suggesting profitability and cash flow considerations and constraints still behind their sustained reluctance to follow the mainstream narrative. If inflation really were going to break out, businesses would be stocking up on everything in advance.
In other words, as usual, the economy can look good in specific quarters, maybe even two quarters, but underneath there remains nothing to suggest a meaningful pickup or acceleration.
(Click on image to enlarge)
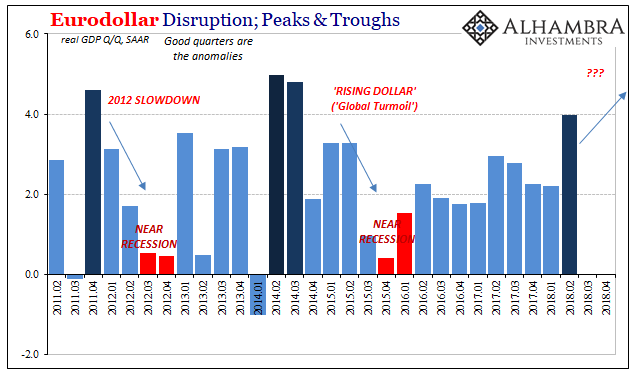
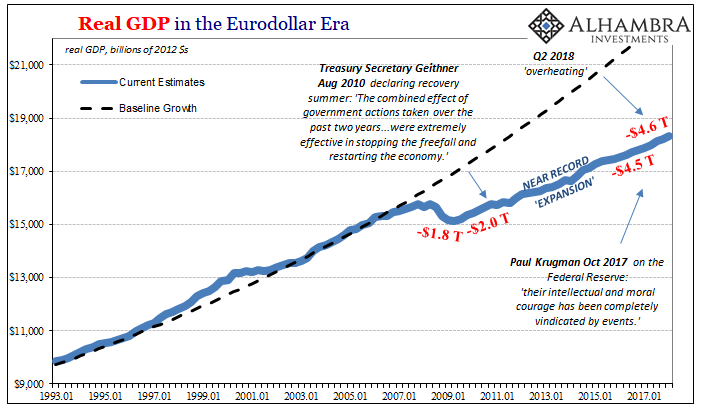
That brings us to the annual benchmark revisions, which so far are causing some confusion. It’s understandable why that may be since at first glance it looks like the US economy got a whole bunch bigger:
(Click on image to enlarge)
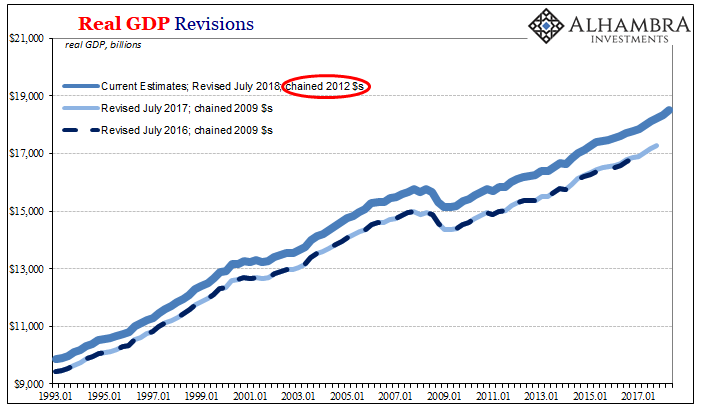
That’s not really what happened, of course. What did was the BEA’s planned switch of its reference year from 2009 to 2012. As such, any kind of “real” calculation is going to be, moving forward, put in terms of 2012 dollars instead of 2009 dollars.
You can see the difference in revisions to nominal GDP, which is where a “bigger” and “better” economy would show up if one had been found in new data.
(Click on image to enlarge)
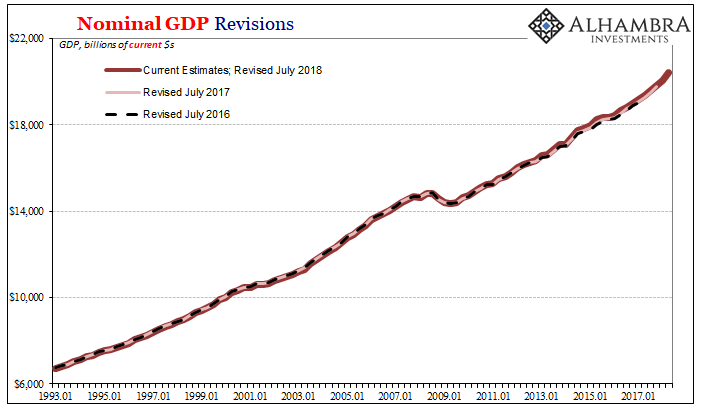
That’s what a serious bout of deflation will do to the numbers. The 2012 pricing reference is a deflationary deflated dollar as compared to the 2009 one, meaning that in the “real” series the economy in 2012 terms is relatively but not meaningfully bigger than it was in 2009 terms.
If your work commute is twenty miles but the government tomorrow says that a mile is ¾ what it used to be, your drive might be numerically longer but you’ll be using the same amount of gasoline no matter what.
This adjustment in 2012 dollars has been applied to the whole data series back to its beginning (1947 for quarterly estimates), not just for recent years or decades.
There are, however, small differences now in quarterly and annual estimate for rates of change, but again these don’t really amount to much. Some years look marginally better, others marginally worse.
(Click on image to enlarge)
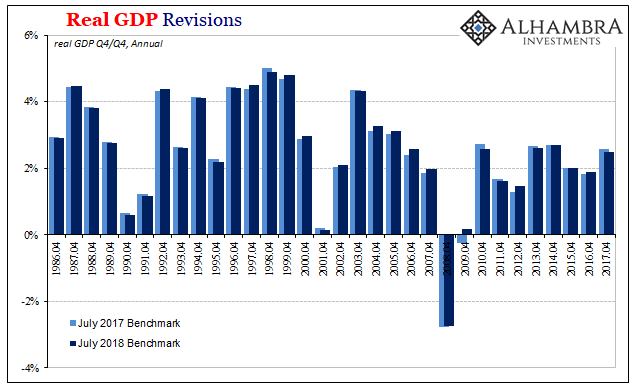
Last year, for example, is now believed to have grown by slightly less than was thought before the new benchmark and reference. Real GDP for 2017 (Q4/Q4) was 2.58% prior but is now 2.47%. Conversely, 2016 was revised upward, if barely, from 1.84% to 1.88%.
On a quarterly basis, there were a few interesting changes mostly in reference to 2015. The first half of that year now looks nothing like it did originally. Under the 2014 benchmarks, the original estimates, Q1 2015 was -0.2% while Q2 was 3.8%. That was changed under, or by, “residual seasonality” hysteria to 2.0% and 2.6%. Two more benchmarks later, and now the BEA says Q1 and Q2 2015 were 3.3% and 3.3%, respectively.
(Click on image to enlarge)
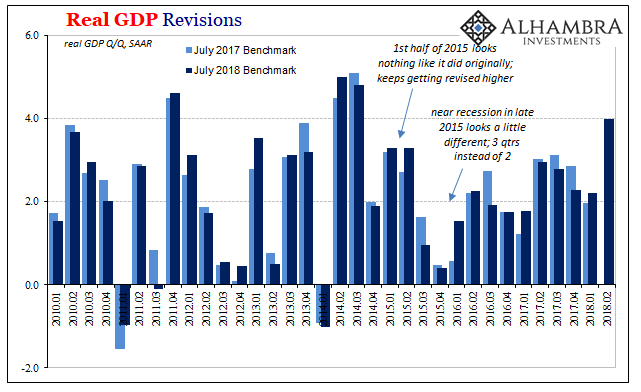
Later in 2015, it’s Q3 that’s essentially “paid” for this apparent strength in the first half. It was originally stated as 2.0% just as “overseas turmoil” was making its presence felt (the same quarter that contained August 2015). Last year’s benchmark fixed that quarter’s growth at 1.6% that this year’s benchmark now changes to just 0.95%.
Q1 2016, on the other hand, has been revised up to 1.5%. It shifts the balance of the near-recession more toward the end of 2015 than spread more evenly in just the two quarters of Q4 2015 and Q1 2016. That actually makes more sense given how events unfolded at that time – where early February 2016 was more like the trough and the three months in Q3 2015 more like the worst of the downturn.
(Click on image to enlarge)
(Click on image to enlarge)

All in all, however, not much has really changed even though every GDP number has. These are small details coloring the events of the past a little differently without altering the pathway to the future. It’s really too bad economic growth wasn’t as easy as a reference dollar revision. In one sense it would be, but that would require first getting the mainstream to see why celebrating one-quarter of 4% (or just near 4%) is ridiculous.
Disclosure: None.


