The Perils Of Citi: The Last Of The Eurodollars Part 1
Proprietary trading has taken on connotations that are extreme for some good reason owing to the events of 2008. It was there, called “principal transactions” on some balance sheets, that claimed the majority of accounting losses that perpetuated internecine banking struggles from liquidity to revenue and earnings. As with most things, there was much more to it than that rough abhorrence, particularly as prop trading is the byproduct of very useful financial function.
The distinction between bank and investment bank used to be more than shorthand for how a firm derived the bulk of its revenue. There were immense statutory as well as functional differences. For the most part, investment banks were securities firms that participated in bridging primary and secondary markets. The term “primary dealers” is derived from that perspective. These are/were firms that float issues and then take risks in warehousing before selling again into the secondary markets (to institutions and even the public).
Hedging is a legitimate exercise of risk control during that warehousing phase. There are also the origins of wholesale funding in the history of investment banking. Under an actual currency system, investment banks had to derive funding from somewhere given that they were not, mostly, depository institutions. The repo market, in particular, began as one of those versions of wholesale, including just the sort of fuzzy attachment to the Federal Reserve we appreciate too much today (the Fed was prohibited from directly lending to securities firms but not from buying UST securities, thus the central bank could agree to “buy” a security from an IB and then “sell” it back at a specified future date, which from the IB perspective was a “repurchase agreement”).
The problem for the eurodollar expansion from especially 1995 forward was the blurring of functions. An investment bank that holds securities from a UST auction with the hard intent to sell them off piecemeal to customers has legitimate risks that it can and should try to manage. It gets exponentially more complicated the further down the risk curve you travel, warehousing everything from vanilla corporate debt to highly complex structured mortgage pools. More complex still are the natural irregularities of both funding arrangements and how all of it is accounted.
The investment bank traditionally booked profit from what was a stretched bid/ask spread, primary to secondary – they bought at auction or direct placement at one price and sold into the secondary market at whatever mark-up they could “earn.” That revenue is proprietary. If the value of the underlying warehoused security should happen to rise over time while in transitory possession of the IB, then more proprietary revenue is “earned.” If the IB places particular hedges upon those securities in order to manage the potential risk of security prices moving and the prices of the hedges instead happen to move in the bank’s favor, that means even more proprietary revenue. At what point, however, does the legitimate warehouse function (including all the risk management add-ons) stop being investment banking and start heading too far into raw speculation?
It’s a murky issue that becomes even more so when attached to other investment banking functions, such as “market making.” In some academic versions of the wholesale system, this is treated as a whole separate area from what I described above. In reality, however, there is no distinction or even the concept of matched-book neutrality. A theoretical money dealer is believed to take in a client order on some derivative trade and then match that order with another client take the opposite side. This theoretical view should have been thrown out by the events of 2008 that showed, in proprietary “trading”, banks were on all sides of every trade sometimes at the same time. It was a tangled mess that involved different parts of the investment bank equation and through enough iterations expressed an actual, accumulated position in one direction or another (market makers are supposed to be neutral to the market they make, but that wasn’t the case with bank after bank being long subprime or CDS even though they were also short subprime and CDS, and were expected to offer still further risk mitigation in both subprime and CDS that would affect whether or not they were long or short subprime and CDS – and then to sort out the accounting of “capital” by implication of all that).
It seems like a distinction of the bubble age but it really was never so cut and dried throughout the history of the securities business. It only seems to matter, for good reasons, too, when losses are large and systemic. In the 1920’s, securities firms funded through call money (securitized lending from “money center” depository institutions using equities as collateral) exploded in volume and then exploded into depression as the decade turned. There is simply no bright dividing line between what is “proper” and what is systemically reckless. That used to be the messy, imperfect function of failure, but the common bypass into these kinds of systemic imbalances seems to be over-monetization.
If there is truly a difference in time periods then to now, it might be in the complications and utter complexity of investment banking far beyond what was ever imagined under hard money and even physical currency-based systems. The credit-based currency regime of the eurodollar opened the door to not just quantitative expansion as in the past but really qualitative distortions (especially after 1995) that are still being sorted out almost a decade after its (artificial) stability was lost. This is the realm of what I have called “dark leverage” because it doesn’t show up in accounting statements that were never meant for it.
Like “dark matter” or “dark energy” in physics, dark leverage can be assumed at times by the large effects that are observed. Citigroup is one example where what seemed like a perfectly upstanding depository institution that happened to own an investment bank division suddenly turned into a taxpayer nightmare of massive, tangled losses that threatened everything from the solvency of the FDIC to wholesale markets. Even though the government started by purchasing $25 billion in preferred Citi stock under TARP in October 2008, it was “forced” by late February 2009 in its third rescue to boost its equity stake to almost 40% (converting preferred to common). The direct reasons were accounting losses eroding the accounting notions of “capital”, but the proximate causes were buried deep on the investment banking side.
In calendar year 2006, under the “Institutional Clients Group” structure, Citi reported net income of $21.5 billion for the whole bank. Of that, $8.6 billion was attributable to net “revenue” in the ICG unit, which was prop trading results of various wholesale functions. That was $2.6 billion more than the $6 billion in net income generated by the Consumer Banking unit, the more traditional depository version of banking (though not purely, as there were far more than loans in the segment).
The next year, 2007, the ICG unit swung to a $4.2 billion loss (and income in Consumer Banking dropped to just $2.2 billion), drastically reducing net income from $21.5 billion to just $3.6 billion. And it only got worse.
In 2008, ICG prop trading reported an unthinkable $20.2 billion loss while Consumer Banking’s was “only” $12.3 billion. With income in other units, Citi managed to limit its destruction to an accounting loss of $27.7 billion; thus, the government’s involvement where the “market” judged that all severe enough to consider extermination.
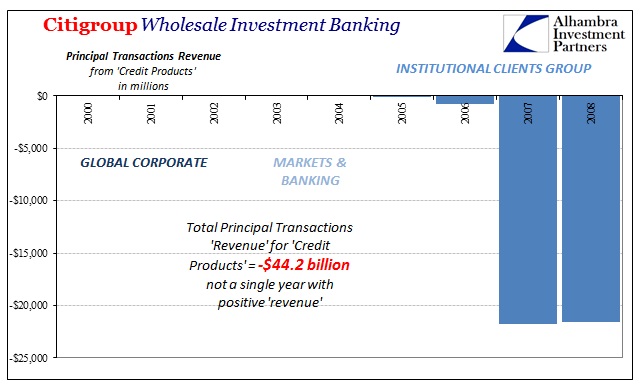
Inside the ICG unit, principal “revenue” was largely being pushed into huge losses because of “credit products”, though not exclusively so in 2008. In fact, ICG never reported anything other than losses for “credit products” through the whole of its history. With credit default swaps surging mostly after 2003 and 2004, fortunately it was a short history.

In four years of reported revenue, the total was -$44 billion! How could that be? There was, obviously, revenue and profit derived elsewhere in the bank which in its accounting statements and presentations are not distinguishable and separable in order to also attribute to these wholesale functions. The greater problem, however, is this dark leverage component which meant that Citi was on the hook for far more than you could have even tabulated or understood when its ICG unit was put together and started writing CDS and other “credit products.” There isn’t any balance sheet format that shows how a “no revenue” prop trading function can suddenly turn into $40+ billion in accumulated losses in really just over a year (August 2007 through Q4 2008), nearly pulling apart the whole global financial system (though, to be fair, Citi had a lot of company in this respect).
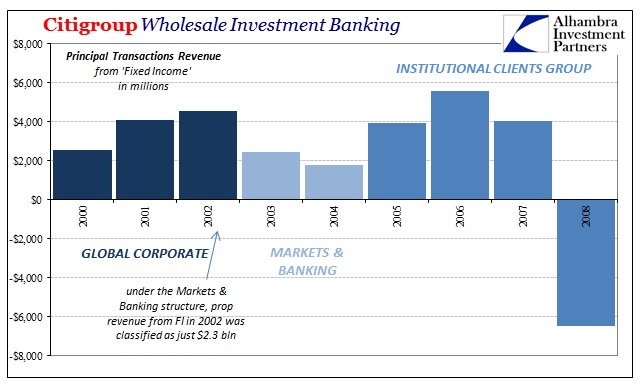
Again, it wasn’t all credit derivatives driving losses in 2008. Principal transactions revenue for “fixed income” was also a huge loss at -$6.5 billion that year. Even without any confirmation in published reports or from the bank itself, we can reasonably infer the “fixed income” functions were related to “credit products” if still distinct as line items.

If you put these two functions together it still doesn’t add up – literally. Comparing principal transactions between Citigroup’s various unit structures in time isn’t straightforward at all. For example, in 2002 under the “Global Corporate” version of principal transactions, Citi records $4.6 billion positive net fixed income revenue. Reorganization under “Markets & Banking” in later years finds only $2.3 billion in principal transactions revenue in fixed income for 2002. By my count of the various configurations which admittedly include at least two discontinuities from the shifting unit arrangements, Citi logged at best $29 billion in total revenues for “fixed income” principal transactions 2000 to 2007. That balances against the $44 billion in overall credit product losses and another $6.5 billion fixed income losses in 2008; $29 billion in positive revenue but more than $50 billion in accumulated negative revenue. There was, in the end, more hidden risk and asymmetry than actual revenue – one form or effect of dark leverage in reverse.
Even if we pull in the rest of ICG or Markets & Banking prop trading revenue, which included the full range of FICC, forex to commodities, that still left $40 billion in total revenue 2000 to 2006 against $40.5 billion in total negative revenue 2007 and 2008. It would be impossible to replicate those results in traditional banking (though, it seems, some banks tried with their intentional foray into subprime mortgages). In short, these numbers are not the full extent of the story as there remains more inside these banks than what accounting statements can ever present.
Though Citi was perhaps toward the extreme end of eurodollar malfeasance, financially speaking, it was not so extreme as to be unrepresentative of the whole systemic balance. The profits were huge before August 9, 2007, but the losses and the asymmetries of the hidden, dark risks disproportionately more revealing. There was simply no going back after those revelations not just on risk but also in view of revenue and full function.
Disclosure: None.


