
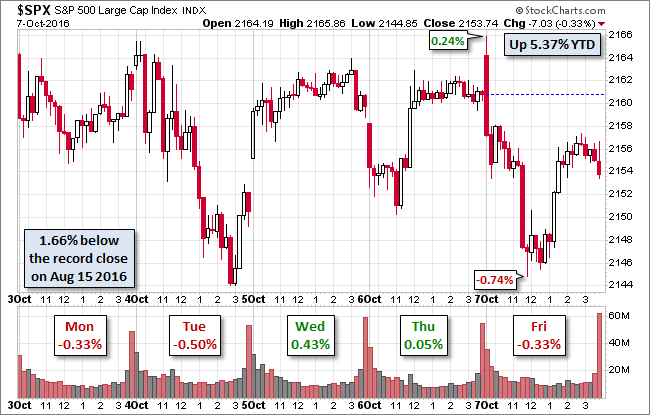
S&P 500 Snapshot: A Modest Friday Loss Snaps A Three-Week Rally
The highly anticipated pre-open release of the September employment report triggered some gyrations at the market open. The two headline data items (the number of new jobs and the unemployment rate) were a bit below expectations, but the overall report was perfectly sound. The S&P 500 hit its 0.24% intraday high in the opening seconds and sold off in a couple of waves to its -0.74% intraday low shortly before the lunch hour. An early afternoon bounce trimmed the loss, and the index closed with 0.33% loss. The 500's -0.67% loss for the week snapped a three-week rally.
The yield on the 10-year note closed down two BPs at 1.73%.
Here is a snapshot of past five sessions in the S&P 500.
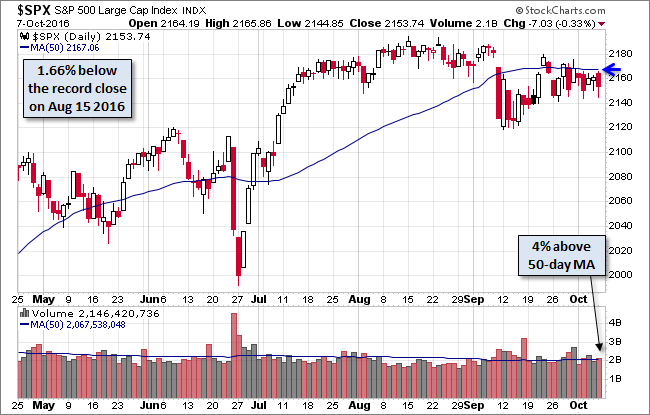
Here is daily chart of the index. Despite the jobs-report drama, trading volume was unremarkable. The market's focus will no doubt shift back to the approaching presidential election.
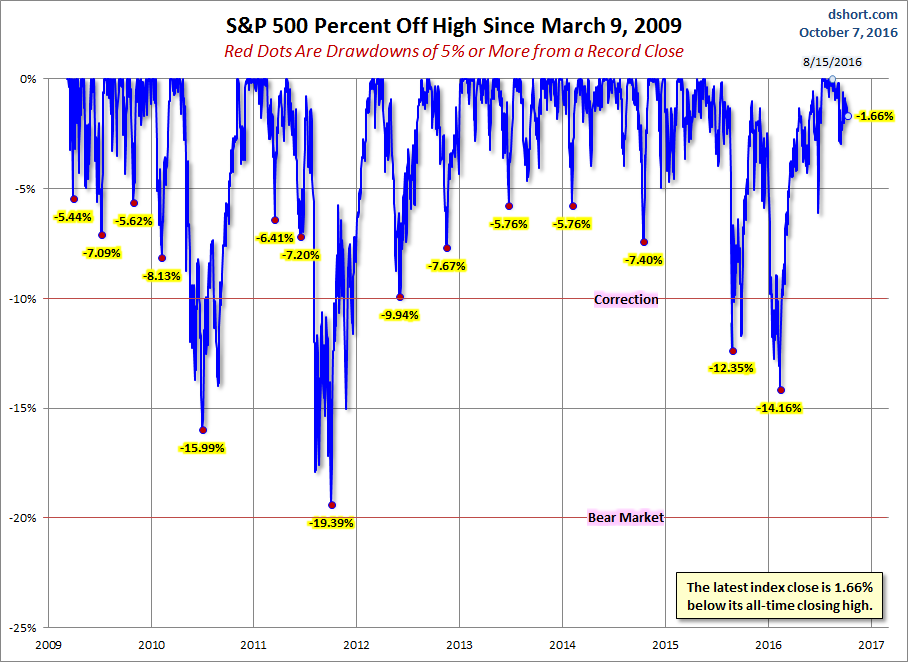
A Perspective on Drawdowns
Here's a snapshot of selloffs since the 2009 trough.
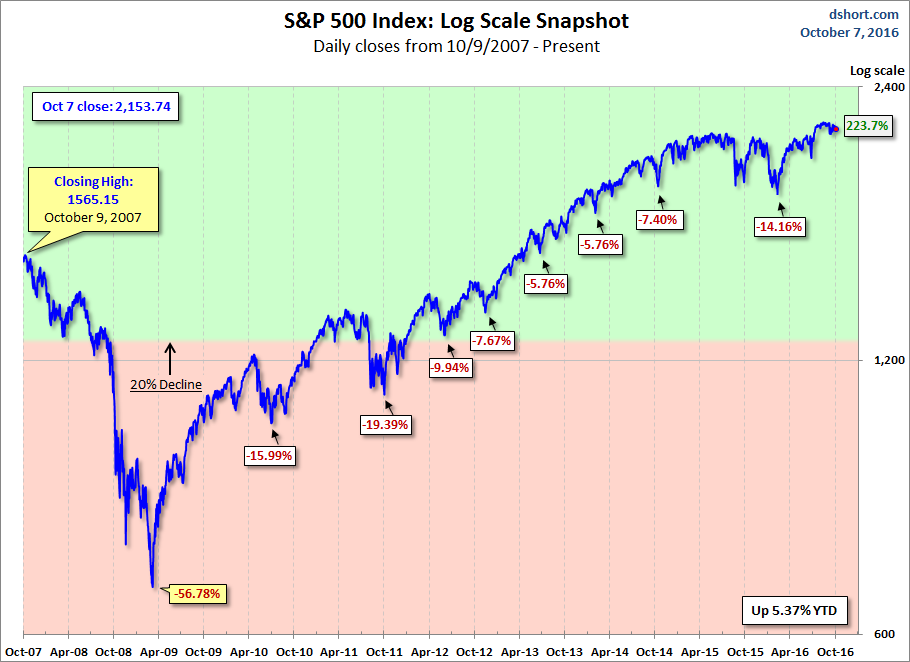
Here is a more conventional log-scale chart with drawdowns highlighted.
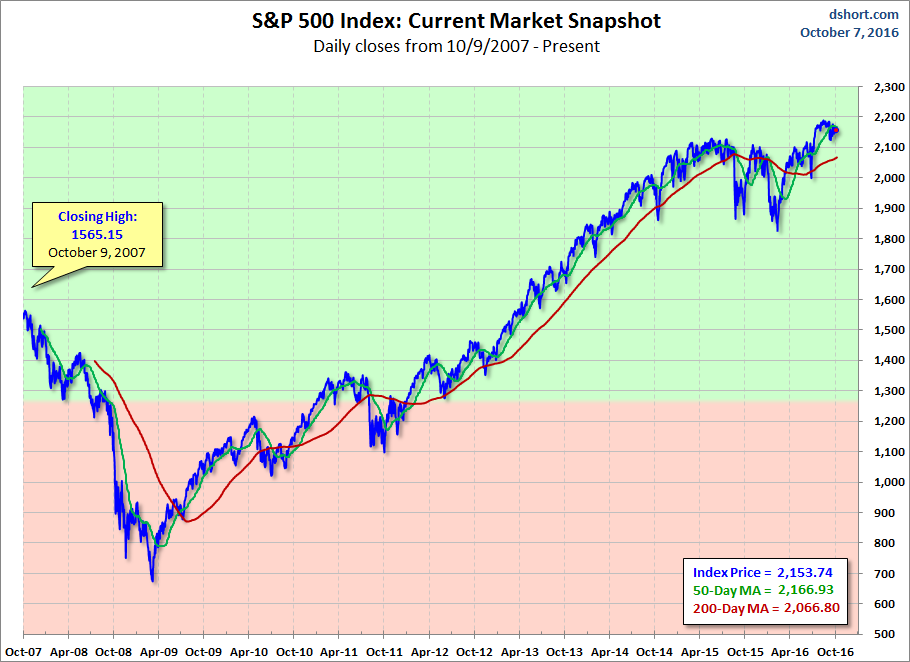
Here is a linear scale version of the same chart with the 50- and 200-day moving averages.
A Perspective on Volatility
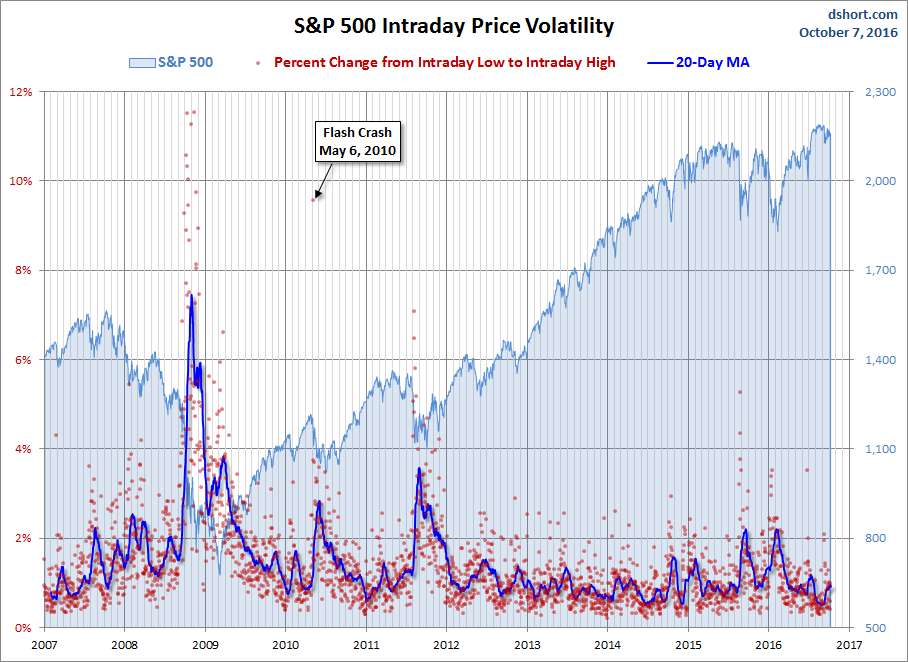
For a sense of the correlation between the closing price and intraday volatility, the chart below overlays the S&P 500 since 2007 with the intraday price range. We've also included a 20-day moving average to help identify trends in volatility.
Disclosure: None.


