
Right On The Midline
Yawn. The excitement of Friday is another distant memory. We’re back to all equities creeping higher, slowly but surely.
I wanted to share with you an index with which I was unfamiliar until SlopeCharts came along – the S&P Total Return Index, which according to Investopedia:
The total return index is a type of equity index that tracks both the capital gains of a group of stocks over time, and assumes that any cash distributions, such as dividends, are reinvested back into the index. Looking at an index’s total return displays a more accurate representation of the index’s performance. By assuming dividends are reinvested, you effectively account for stocks in an index that do not issue dividends and instead, reinvest their earnings within the underlying company.
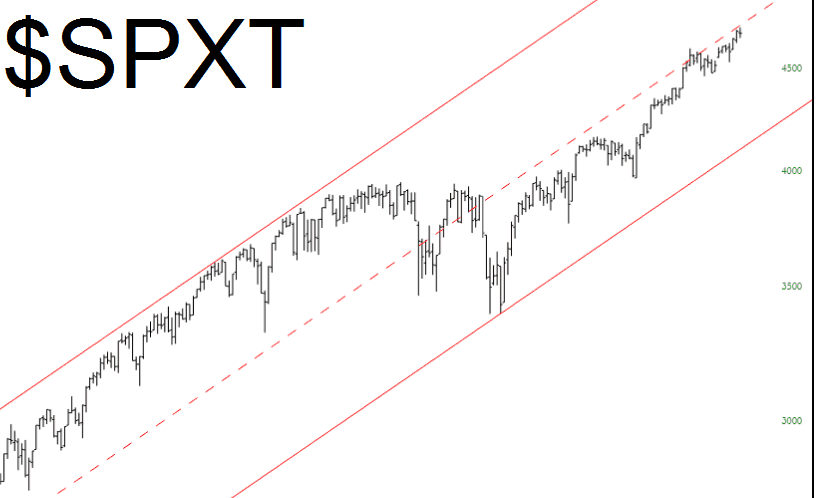
Below is the S&P 500 total return index from SlopeCharts, and as you can see, it’s been ascending along a channel for years. For a while, it was in the upper half of the channel, and in recent years, it’s been in the lower half of the same channel. At the moment, it’s mushed right up against the midline, which suggests how prone equities are right now.
(Click on image to enlarge)
Disclosure: None.

Comments
 No Thumbs up yet!

