Personal Income And Spending Change Again
The only economic data of note yesterday was the notoriously unreliable personal income and spending figures. The data series contained within the suite are subject to not just major benchmark revisions but significant revisions within just the high frequency time frames. Perhaps the most pertinent example of this is the personal savings rate which has been revised all over the place such that there cannot be any confidence whatsoever in the statistic.
As of this moment and the latest data, the personal savings rate is thought to be 5.7% in July 2016, up from 5.5% in June. Last month, the savings rate for June was originally believed to be 5.3%, but is now higher because income was revised up for the past four months.


While spending figures were revised slightly lower, more income can only mean then a temporarily greater savings tendency at least until both spending and income undergo repeated significant revisions in the future. In terms of real disposable income less transfer payments, one of the income series that the NBER somehow relies upon to aid its search for cycle peaks, what was a flat trend in all of 2016 has now been remodeled into a decrease at the start of the year and then a gentle upslope out of it.


It is not, however, significantly different in economic terms because what actually matters is that the decrease at the start of the year survives (so far); meaning it increasingly likely (as that shift lingers throughout subsequent revisions) that there was a real interruption in income growth at the start of the year that was likely felt by US consumers. If only there could be some certainty as to whether or how much of any of that occurred.

Even with the latest revisions, income has significantly slowed. From that perspective, the lack of further economic growth in Q2 2016 as represented by GDP makes some sense even though quarter-over-quarter PCE was better than Q1. Had income not been interrupted or declined at the start of the year in actual economic conditions it is possible Q2 GDP would have amounted to a much more substantial bounce (or even a rebound at all).
Instead, we are left wondering just how damaged the overall economy has been under this “rising dollar” period, a task made incredibly difficult from this perspective by not just the constant reshaping of trends and patterns via significant revisions but also the inclusions of large and unnecessary (in my view) imputations and phantom economic accounts in the first place. In other words, there is a good chance that “something” happened at the start of 2016 that may explain the rest of this year in some part; it is just impossible to tell from these ever-changing numbers (and the way they are put together in the first place) what it was and by how much.
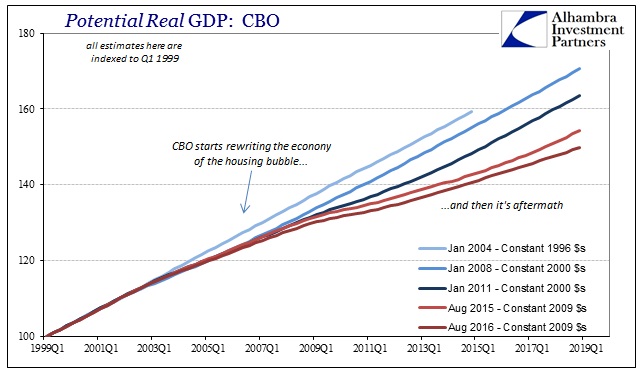
In long run terms, however, economic damage is perfectly clear and consistent with what I wrote about this morning with regard to downgrades in “potential”, as even revisions don’t accomplish much in any direction.


Disclosure: None.


