
Navient Dethrones HP Enterprise On S&P 500 Top Stock List
We can use our data to track individual stocks, industries, sectors, and indices. For today's bulletin, we present key metrics for the top picks in the S&P 500. The companies listed below represent the top-ten BUY/STRONG BUY stocks within the index. They are presented below according to their one-month forecast target prices.
This week, we saw a 60% turnover for our list since the last time we looked at the SP500 at the beginning of December. We also have a new leader, Navient Corp., which swapped positions with--and dethroned-- Hewlett-Packard Enterprise.
Besides Hewlett-Packard Enterprise and Navient, we also see Applied Materials and Time Warner once again this month. Those two stocks declined a few positions each and Time Warner just managed to stay in the top-ten this time around.
Other newcomers include Lincoln National, UNUM Group, Ryder, United Rentals, Discover, and Hewlett Packard Inc.
While we have a tech-heavy list yet again, we also see that Consumer Discretionary and Finance firms are well-represented on our last Index top-ten list of 2016. In addition, the first three firms are ranked STRONG BUY-- along with Applied Materials. The remaining components on this list are BUY-rated.
|
Ticker |
Company Name |
Market Price |
Valuation |
Last 12-M Retrn |
1-M Forecast Retn |
1-Yr Forecast Retn |
P/E Ratio |
Sector Name |
Dec. 1, 2016 |
|
NAVIENT CORP |
16.45 |
23.51% |
43.54% |
1.17% |
14.02% |
8.88 |
Finance |
HPE |
|
|
HEWLETT PKD ENT |
23.3 |
N/A |
52.99% |
1.13% |
13.61% |
12.01 |
Computer and Technology |
NAVI |
|
|
LINCOLN NATL-IN |
66.6 |
16.00% |
31.62% |
1.02% |
12.25% |
10.62 |
Finance |
URBN |
|
|
UNUM GROUP |
43.96 |
15.14% |
31.54% |
0.99% |
11.82% |
11.29 |
Finance |
AMAT |
|
|
APPLD MATLS INC |
32.9 |
7.20% |
73.16% |
0.98% |
11.73% |
17.38 |
Computer and Technology |
TWX |
|
|
RYDER SYS |
75.18 |
9.69% |
33.23% |
0.96% |
11.50% |
12.88 |
Transportation |
SNI |
|
|
UTD RENTALS INC |
106.21 |
40.04% |
46.56% |
0.95% |
11.41% |
12.78 |
Construction |
LRCX |
|
|
DISCOVER FIN SV |
71.91 |
11.77% |
32.31% |
0.94% |
11.33% |
12.63 |
Finance |
EXC |
|
|
HP INC |
14.94 |
40.65% |
28.46% |
0.94% |
11.26% |
9.26 |
Computer and Technology |
QCOM |
|
|
TIME WARNER INC |
96.22 |
2.98% |
49.22% |
0.93% |
11.18% |
16.71 |
Consumer Discretionary |
BBY |
NOTE: New stocks are in BOLD
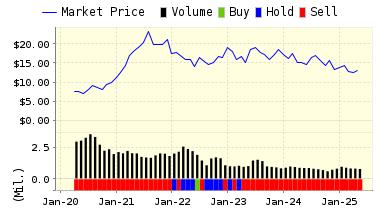
Below is today's data on our SP500 top-ten leader, loan giant Navient (NAVI):
Navient Corporation offers a variety of loan management, servicing and asset recovery services to clients in higher education, and federal, state, and local governments. The Company operates in four segments: Consumer Lending, Business Services, FFELP Loans and Other. The Company acts as a servicer for Department of Education and FFELP loans as well as private student loans. Navient Corporation is based in United States.
ValuEngine continues its STRONG BUY recommendation on NAVIENT CORP for 2016-12-28. Based on the information we have gathered and our resulting research, we feel that NAVIENT CORP has the probability to OUTPERFORM average market performance for the next year. The company exhibits ATTRACTIVE P/E Ratio and Company Size.
|
ValuEngine Forecast |
||
|
Target |
Expected |
|
|---|---|---|
|
1-Month |
16.64 | 1.17% |
|
3-Month |
17.07 | 3.77% |
|
6-Month |
17.56 | 6.77% |
|
1-Year |
18.76 | 14.02% |
|
2-Year |
19.83 | 20.55% |
|
3-Year |
20.49 | 24.53% |
|
Valuation & Rankings |
|||
|
Valuation |
23.51% overvalued |
Valuation Rank(?) |
|
|
1-M Forecast Return |
1.17% |
1-M Forecast Return Rank |
|
|
12-M Return |
43.54% |
Momentum Rank(?) |
|
|
Sharpe Ratio |
0.08 |
Sharpe Ratio Rank(?) |
|
|
5-Y Avg Annual Return |
3.47% |
5-Y Avg Annual Rtn Rank |
|
|
Volatility |
40.78% |
Volatility Rank(?) |
|
|
Expected EPS Growth |
3.06% |
EPS Growth Rank(?) |
|
|
Market Cap (billions) |
6.61 |
Size Rank |
|
|
Trailing P/E Ratio |
8.88 |
Trailing P/E Rank(?) |
|
|
Forward P/E Ratio |
8.61 |
Forward P/E Ratio Rank |
|
|
PEG Ratio |
2.90 |
PEG Ratio Rank |
|
|
Price/Sales |
1.31 |
Price/Sales Rank(?) |
|
|
Market/Book |
2.16 |
Market/Book Rank(?) |
|
|
Beta |
2.66 |
Beta Rank |
|
|
Alpha |
0.22 |
Alpha Rank |
|
Disclaimer: ValuEngine.com is an independent research ...
more

