Maybe More Than A Matter Of Timing
For the tenth straight week, dating back to the week just before the global liquidations in August, reported domestic crude inventories increased. At 489.4 million barrels, the current level of oil stock (excluding the SPR) is only slightly less than the record high of 490.9 million barrels reached the week of April 24. “Transitory” is dead.
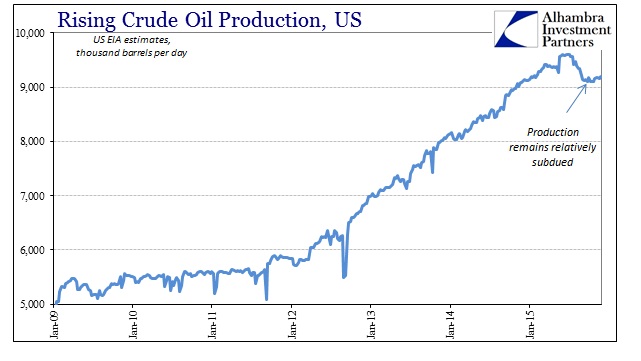
The increase in oil inventories comes again even as domestic production stalls at a significantly lower level than back in April. The only answer is, again, demand, as an astounding 35.5 million additional barrels have found themselves in storage just in those ten weeks since the heaviest breach of the latest “dollar” run.

Given those continuing depressive dynamics, crude prices again flirt with $30, with the January 2016 futures trading as low as $39.84 today. Just as in that August turmoil, the crude/WTI futures curve is quite as flat and bearish now even though outwardly commentary and convention (which includes FOMC positioning) seems quite assured to have moved on.
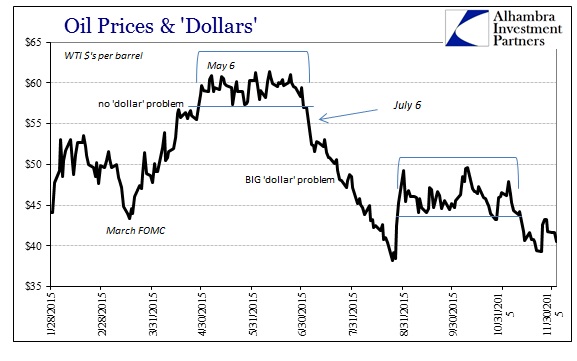

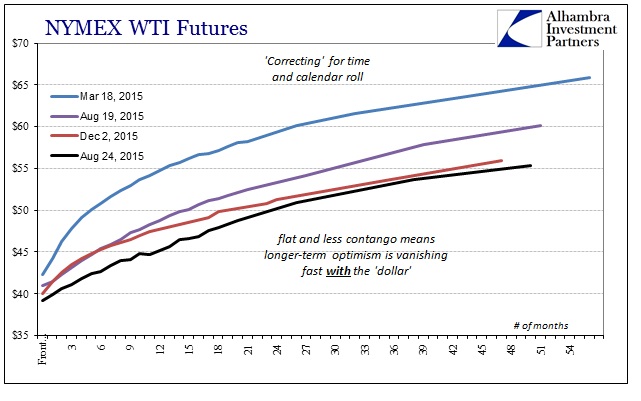
These prices look nothing like the economic and financial conditions that demand the FOMC end ZIRP (not that ZIRP would do anything positive to begin with) lest this and the global economy overheat. Monetary practitioners are always finding themselves worried about being “behind the curve” in terms of inflation, and thus they only grow impatient and more so after each deliberative delay. What we see here is that there is no such curve for the FOMC to be behind, as nothing they suggest is even remotely priced on any front.
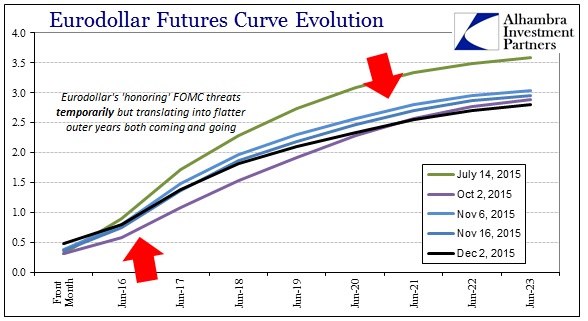
That includes, of course, the direct relation between these commodities, particularly crude, and crude eurodollar financialism that has performed the anti-ZIRP activities in 2015. After obliging FOMC rhetoric in late October, the eurodollar futures curve continues to renew its bearish flattening. Some attention is paid to the policy threat, but overall the curve suggests once more the opposite of what excites mainstream economic concerns (at least those expressed in public).

Even the UST curve is being traded in that manner, as the belly continues to flatten down to close to its early 2015 absolute cycle lows. There is some additional pressure in the 2s30s, the long curve view, but that, once again, speaks to how monetary policy can do little but make it all that much worse. In other words, the back end is flattening no matter what (5s and out) and there is but clear additional pressure inside where the Fed is given the most charitable perceptions (that they actually have some ability beyond moral suasion).


Earlier today, in referencing Citigroup enlisting a rather high recession probability (for orthodox economists), they did so in the context of such yield curve inversion. That would make sense given at least the dynamics in the UST curve already, but I think the inversion fetish rests upon some anachronistic assumptions and correlations. Primary among those is the foundation for it at the start, namely short-term interest rates that have little bearing in actual investment and economic considerations.
Beyond that, the yield curve has already and for quite some time been “flowing” in the negative economic direction. Flattening started in earnest on November 20, 2013, which was a date more notable for hidden fireworks of some still unspecified kind in swap trading (my own personal conjecture still holds the lingering aftershocks of the MBS rout from June as the primary contagion point, with the UST curve steepening thereafter making either TBA delivery in production coupons or dollar rolls increasingly too difficult throughout the financial spectrum to the point that dealer activities, IR swaps themselves and risk absorption factors, simply “broke”; it hasn’t been the same since). In that view, the absolute level of attainment toward “inversion” in the yield curve is less important than the dealer activities that underpin the wholesale “dollar” – such as indicated by swap spreads.

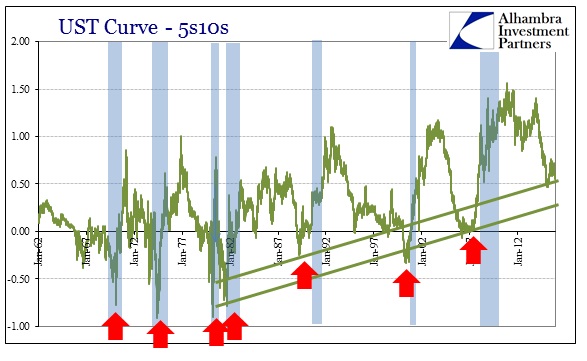
From that view, what is important about the UST curve is that it might foresee and then confirm the behavior in swaps markets (now become more and more misbehavior). The UST curve is compelled toward respecting monetary policy even where monetary policy holds no actual meaning or governance; the swaps market and dark leverage is far less susceptible to the artificiality of such projection. The introduction of interest rate targeting in the 1980’s meant exactly that, which is what we see in the altered history of the UST curve – it has grown steeper not as a market condition, and certainly not as the economy has been much better in the 2000’s, but only so far as policy has increasingly intruded. Thus, on the flipside, the tendency toward inversion is likewise suppressed by the same factor.
But more than that, that artificiality is introduced through a money market mechanism that has increasingly been relegated to irrelevance. The Fed wants you to think the federal funds rate matters, and it did at one point, but global liquidity is conducted far differently now than at any other point in those prior decades. On that matter alone, you have to question what exactly the UST curve is, again, projecting at least on the front side of the curve equation.
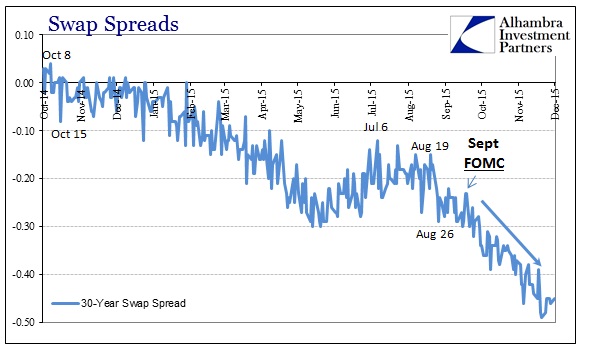

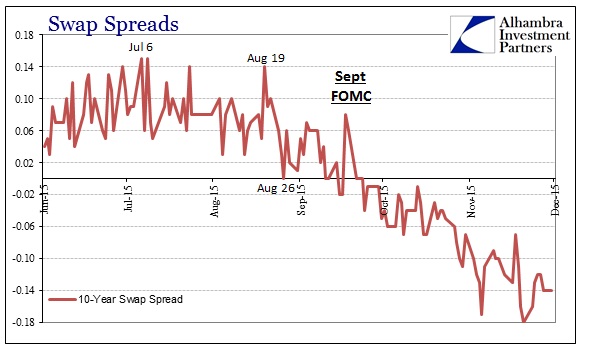

Swap markets, on the other hand, hold no such illusions; the belly of the yield curve (5s10s) right now is as steep as it ever was throughout the middle and late 1980’s, yet, outside of Janet Yellen’s ongoing economic fairy tale, it would be impossible to make any kind of economic comparison to justify that recurrence. Instead, all that says is the yield curve respects monetary influence now still to some degree, but in an ever-decreasing manner (the flattening since November 2013). Swap spreads, by contrast, have blasted through the looking glass into what in far more important respects is rabid “tightening” already – no need to wait for some inversion to confirm what has by now in many places occurred.
In the end, these distinctions may be more about timing than outcome; as both suggest the same thing for somewhat different reasons. Again, in my view, the UST curve is relevant only insofar as it remains flat to flatter in comparison to 2013 and before, where that artificial steepening was not an economic expectation so much as policy expectation. The reversal since in the UST curve is an unwinding of that monetary policy magic toward something far less desirable. From there, swap rates pick up the extrapolations which assign the kinds of economic conditions where oil inventories would be at record highs and rising at the same time the FOMC is proclaiming full recovery and rising “inflation.” Swap spreads, in short, don’t believe any of those policy caprices, and the UST curve is in the middle believing less and less.
Disclosure: None.


