JPMorgan Chase Dethrones IBM As Dow Leader
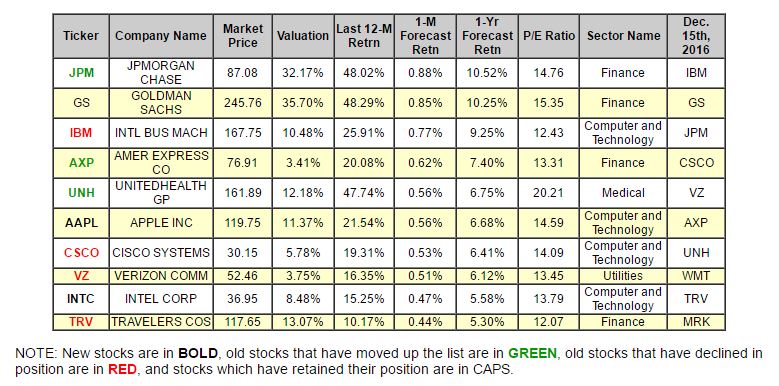
The companies listed below represent the top stocks within the index. They are presented below according to their one-month forecast gain.
We only have a 20% turnover this month as newcomers Intel and Apple replace Wal-Mart and Merck.
IBM could not retain its top spot and falls two spots to third as JPMorgan Chase is our new leader. Cisco Systems, Verizon, and prior, long-time leader Traveler's also declined.
Moving up this month--in addition to the aforementioned JPM, are American Express and United Health
Currently we have no STRONG BUY-rated stocks in the DOW right now. Our entire top-ten list consists of BUY-rated equities.

Below is today's data on Apple (AAPL):
Apple Inc. is engaged in designing, manufacturing and marketing mobile communication and media devices, personal computers, and portable digital music players. The Company's products and services include iPhone, iPad, Mac, iPod, Apple TV, a portfolio of consumer and professional software applications, the iOS and Mac OS X operating systems, iCloud, and a range of accessory, service and support offerings. It sells its products worldwide through its online stores, its retail stores, its direct sales force, third-party wholesalers, and resellers. Apple Inc. is headquartered in Cupertino, California.
Recommendation: We continues with a BUY recommendation on APPLE INC for 2017-01-11. Based on the information we have gathered and our resulting research, we feel that APPLE INC has the probability to OUTPERFORM average market performance for the next year. The company exhibits ATTRACTIVE Company Size and P/E Ratio.

|
ValuEngine Forecast |
||
|
Target |
Expected |
|
|---|---|---|
|
1-Month |
120.42 | 0.56% |
|
3-Month |
121.71 | 1.64% |
|
6-Month |
122.67 | 2.44% |
|
1-Year |
127.75 | 6.68% |
|
2-Year |
131.20 | 9.56% |
|
3-Year |
133.09 | 11.14% |
|
Valuation & Rankings |
|||
|
Valuation |
11.37% overvalued |
Valuation Rank |
|
|
1-M Forecast Return |
0.56% |
1-M Forecast Return Rank |
|
|
12-M Return |
21.54% |
Momentum Rank |
|
|
Sharpe Ratio |
0.55 |
Sharpe Ratio Rank |
|
|
5-Y Avg Annual Return |
13.88% |
5-Y Avg Annual Rtn Rank |
|
|
Volatility |
25.47% |
Volatility Rank |
|
|
Expected EPS Growth |
9.74% |
EPS Growth Rank |
|
|
Market Cap (billions) |
697.51 |
Size Rank |
|
|
Trailing P/E Ratio |
14.59 |
Trailing P/E Rank |
|
|
Forward P/E Ratio |
13.29 |
Forward P/E Ratio Rank |
|
|
PEG Ratio |
1.50 |
PEG Ratio Rank |
|
|
Price/Sales |
3.23 |
Price/Sales Rank |
|
|
Market/Book |
5.83 |
Market/Book Rank |
|
|
Beta |
1.26 |
Beta Rank |
|
|
Alpha |
-0.02 |
Alpha Rank |
|
Market Overview
|
Summary of VE Stock Universe |
|
|
Stocks Undervalued |
34.23% |
|
Stocks Overvalued |
65.77% |
|
Stocks Undervalued by 20% |
14.27% |
|
Stocks Overvalued by 20% |
30.95% |
Sector Overview
|
Sector |
Change |
MTD |
YTD |
Valuation |
Last 12-MReturn |
P/E Ratio |
|
Multi-Sector Conglomerates |
0.23% |
1.82% |
1.82% |
18.78% overvalued |
23.11% |
20.05 |
|
Industrial Products |
0.38% |
1.75% |
1.75% |
18.65% overvalued |
33.27% |
24.83 |
|
Oils-Energy |
1.03% |
2.97% |
2.97% |
18.36% overvalued |
46.18% |
26.79 |
|
Finance |
0.12% |
1.31% |
1.31% |
16.00% overvalued |
21.16% |
18.14 |
|
Aerospace |
-0.07% |
1.91% |
1.91% |
14.28% overvalued |
13.50% |
20.76 |
|
Basic Materials |
0.94% |
5.45% |
5.43% |
14.14% overvalued |
80.95% |
28.72 |
|
Business Services |
0.19% |
0.93% |
0.93% |
12.30% overvalued |
14.81% |
24.42 |
|
Transportation |
0.64% |
2.93% |
2.93% |
11.94% overvalued |
28.57% |
18.47 |
|
Construction |
0.35% |
1.33% |
1.33% |
11.04% overvalued |
33.01% |
21.55 |
|
Utilities |
0.26% |
1.75% |
1.75% |
10.52% overvalued |
23.11% |
21.94 |
|
Computer and Technology |
0.26% |
2.50% |
3.08% |
9.77% overvalued |
21.36% |
31.29 |
|
Auto-Tires-Trucks |
-0.00% |
2.15% |
2.15% |
8.62% overvalued |
34.87% |
14.92 |
|
Consumer Discretionary |
-0.20% |
1.33% |
1.33% |
4.90% overvalued |
25.25% |
23.92 |
|
Consumer Staples |
0.18% |
0.73% |
0.73% |
4.15% overvalued |
13.18% |
24.03 |
|
Retail-Wholesale |
-0.34% |
-0.13% |
-0.13% |
0.92% overvalued |
10.17% |
23.16 |
|
Medical |
-0.49% |
4.52% |
4.52% |
4.62% undervalued |
2.12% |
28.33 |
Disclaimer: ValuEngine.com is an independent research ...
more


