January 2018 Market Wrap-Up
We could see a tepid recovery of yesterday's "shock drop" in equities (as I described here), until the Fed's next interest rate hike (possibly in March), to send Major Indices to levels somewhat higher than their recent all-time highs. But, we'll likely see higher volatility remain in play and, possibly, more wild price swings, until then.
As I promised in that post, here's January's month-end summary.
DOW 30 INDEX
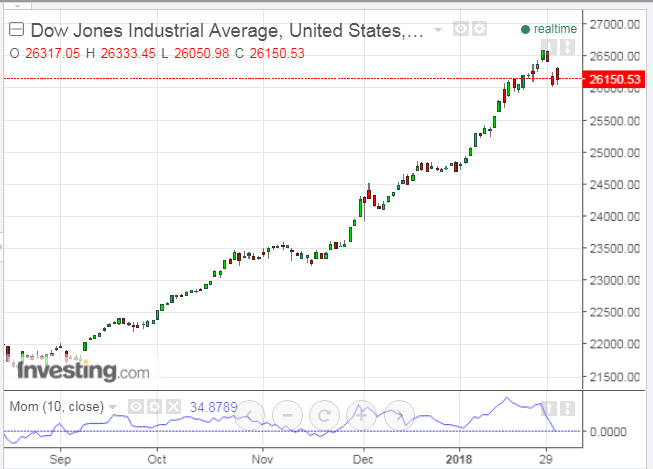
The first daily chart shows that the Dow 30 Index failed to fill yesterday's gap down and closed 100 points above its low of the day.
Momentum remains above the zero level, but has dropped dramatically after failing to rise to a new high when the Dow made its last new high on January 26. It's an important level to hold in support of such a recovery. Otherwise, a drop and hold below zero would see further weakness in the Dow.
S&P 500 INDEX
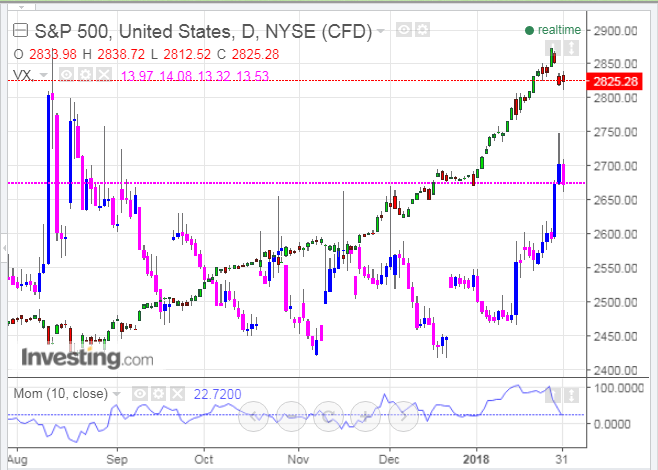
The next daily chart shows that the S&P 500 Index failed to fill yesterday's gap down and closed off its low of the day. The VIX is overlayed on this chart and price remains above near-term support of 13.00.
Momentum remains above the zero level, but has dropped dramatically after failing to rise to a new high when the SPX made its last new high on January 26. It's an important level to hold in support of such a recovery. Otherwise, a drop and hold below zero would see further weakness in the SPX.
NASDAQ COMPOSITE INDEX
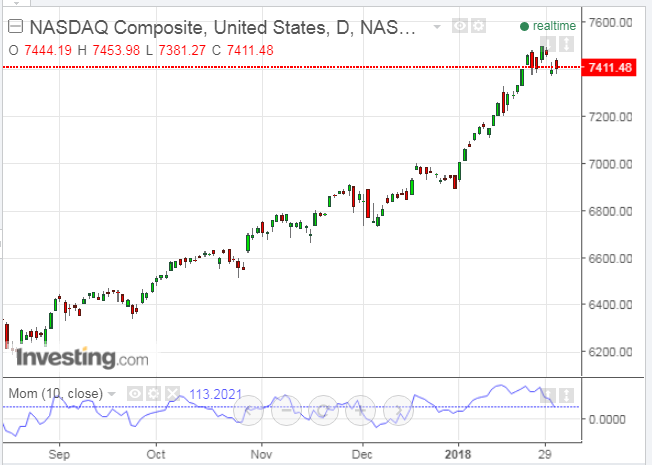
The next daily chart shows that the Nasdaq Composite Index came within a couple of points of filling yesterday's gap down and closed off its low of the day.
Momentum remains above the zero level, but has dropped dramatically after failing to rise to a new high when the Nasdaq made its last new high on January 26. It's an important level to hold in support of such a recovery. Otherwise, a drop and hold below zero would see further weakness in the Nasdaq.
RUSSELL 2000 INDEX
The next daily chart shows that the Russell 2000 Index came within about three points of filling yesterday's gap down and closed near its low of the day with a bearish engulfing candle.
Momentum has dropped below the zero level, and a hold below this signals weakness ahead for the Russell.

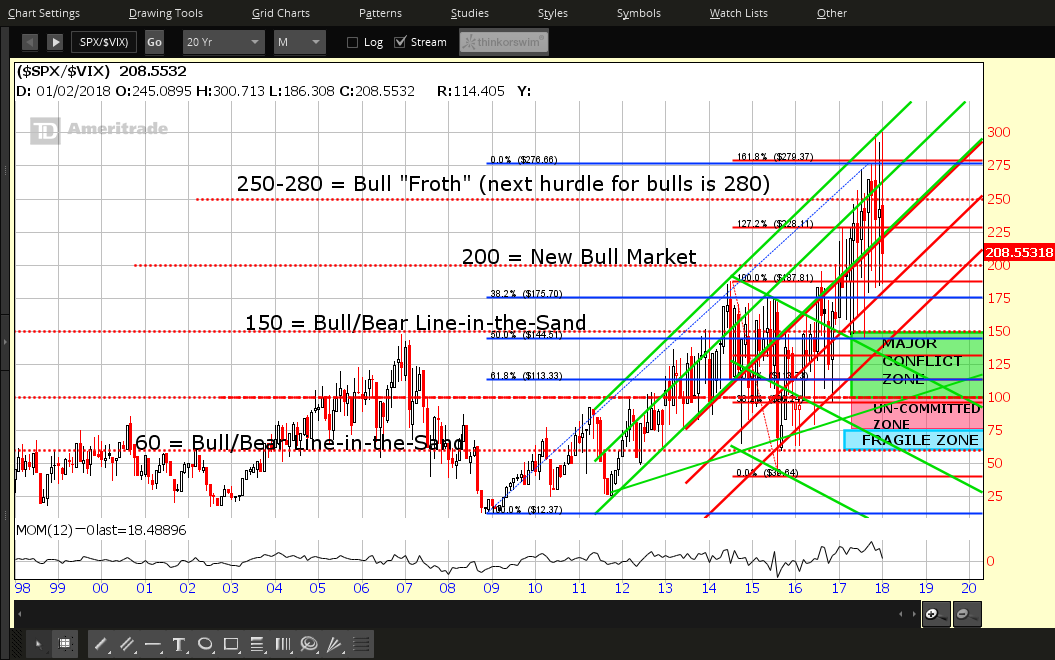
SPX:VIX RATIO
The following monthly chart of the SPX:VIX ratio shows January's close just above major support of 200, after dipping and closing below in yesterday's session. You can see that volatility has risen substantially on this ratio this month. It's not yet out of control, but it could be if price drops and holds below 200.
The momentum indicator has risen a bit from yesterday and remains above the zero level. A drop and hold below zero, as well as the 200 price level, would indicate accelerating selling pressure in equities.
(Click on image to enlarge)
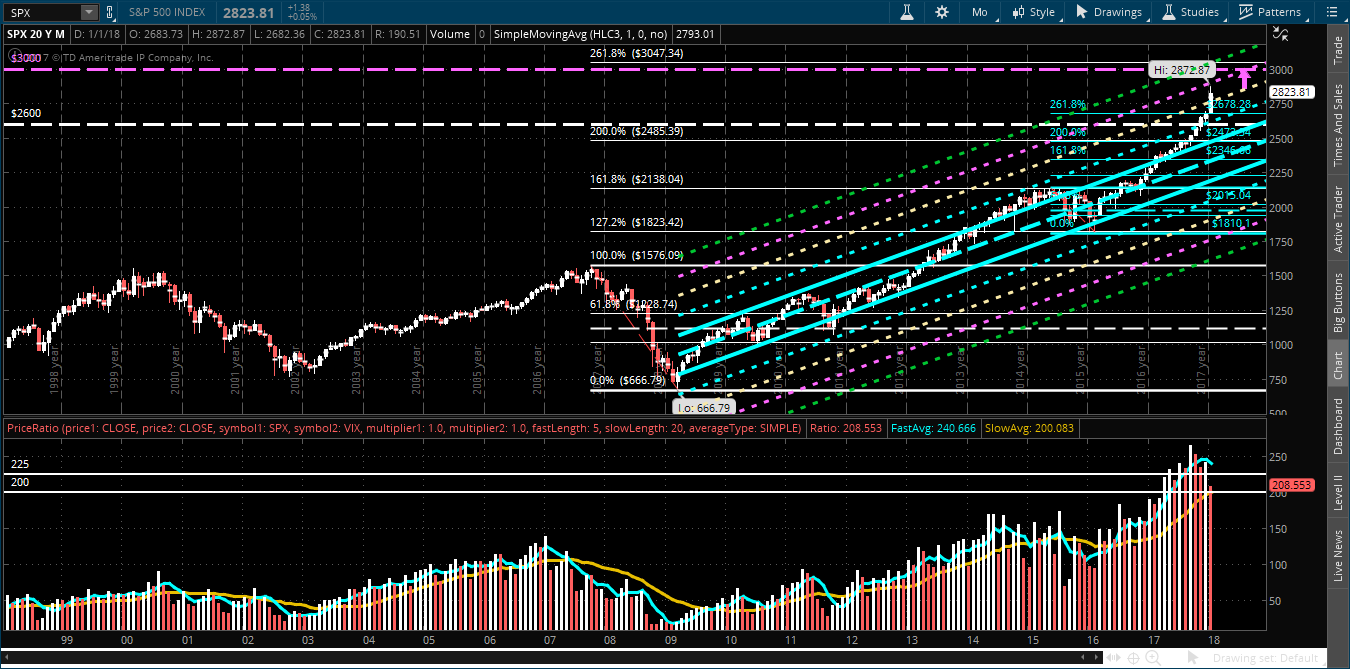
And, for a slightly different perspective, this next monthly chart depicts the SPX in the upper half and the SPX:VIX ratio in the lower half (in histogram format of monthly closing prices only).
January's price on the ratio rose back above yesterday's close and is now back above the 20-month moving average (yellow), once more. A drop and hold below this level would coincide with increased selling in the SPX.
(Click on image to enlarge)
As an aside, I'll add the following observations...
10 YRT & US DOLLAR INDEX
The following monthly chart shows a very long view of the 10 YR Treasury rates (green & red candles) compared with the US Dollar Index (blue & pink candles). [I wrote about 10-Year Yields ($TNX) in yesterday's post.]
Momentum of the 10YRT remains above the zero level...an important level to hold if rates continue to rise.

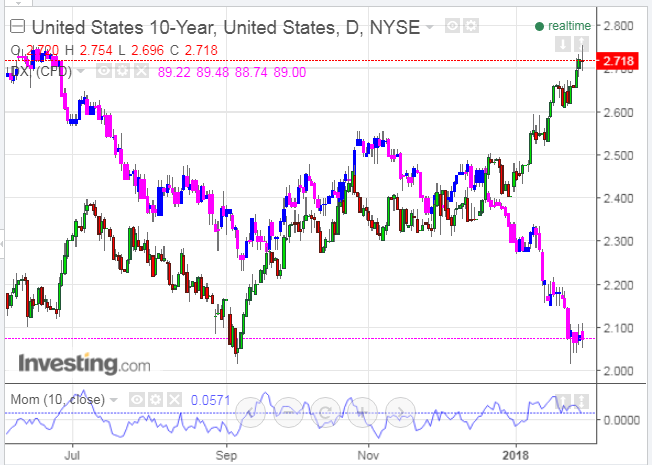
A closer daily view of these two shows that the dollar is trying to form a base, from which to rise, while the 10YRT spiked briefly at the conclusion of today's Fed interest rate meeting, but closed off its high of the day.
Momentum of the 10YRT remains above the zero level, but has failed to make a higher swing high on this latest push higher over the past couple of days. A drop and hold below zero would see some weakness set in and rates fall.
US DOLLAR INDEX
A longer monthly view of just the US Dollar Index shows that price remains below a major resistance level of 90.00...and momentum firmly below zero.
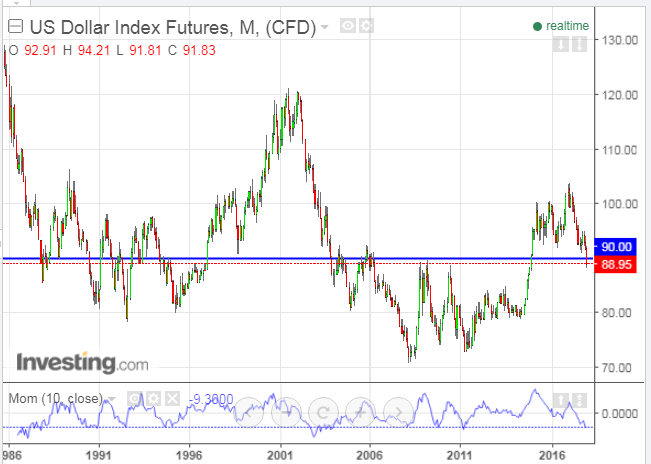
As the dollar attempts to stabilize at current levels, momentum is moving upward and is just below zeroon a shorter-term daily basis. Watch for a spike and hold above zero to suggest that the dollar is gaining strength, and for price to break and hold above 90.00. Alternatively, a hold below both of these could see more weakness ahead...two levels to monitor, in combination.

WORLD MARKET HEAT MAP
Lastly, world markets paused on Wednesday, for the most part, following yesterday's large-scale sell-off. We'll see how long that lasts.

Source: CNBC.com


