Is The Bull Market On The Ropes?
Ominous Start In 2016
If last week felt like an odd start to a new trading year, there was a good reason; it was odd. From CNBC:
This was the worst year-starting five trading sessions ever in the history of both the S&P 500 and the older Dow Jones Industrial Average (created in the middle of 1896).
Worst First Day Of The Year Since…
The first trading day of the year was the worst since 2008 for the Dow. In 2008, the S&P 500 lost over 36%. For the S&P 500 and NASDAQ, it was the worst first trading day of the year since 2001. In calendar years 2001 and 2002, the S&P 500 lost 11.85% and 21.97% respectively. Unfortunately, as outlined in this week’s stock market video, the stats above are not the only similarities to 2001 and 2008, telling us it is prudent to double-check our bear market contingency plans.
Broad Market Takes Out Low
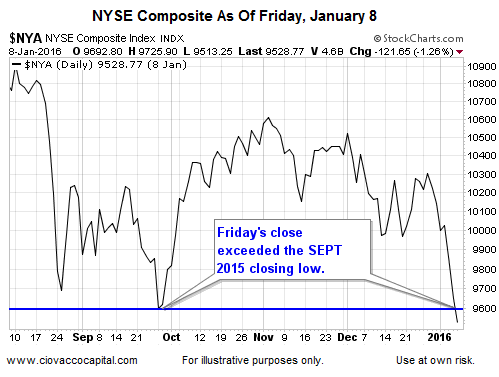
On Friday, January 8, the S&P 500 closed below the area that acted as support in September 2015 (see chart below). The longer the NYSE stays below 9601, the more concerning it becomes relative to the bullish case for stocks.

Monday Brought More Concerns
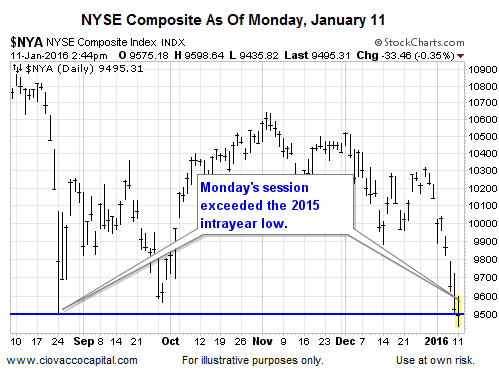
The version of the NYSE chart below is based on high, low, and closing prices. During Monday’s trading session, the intraday low for 2015 was exceeded. The longer the NYSE stays below 9509, the more concerning it becomes. If the market can find some support and stay above 9509, the odds for a bounce/rally will improve.

Disclosure: This post contains the current opinions of the author but not necessarily those of Ciovacco Capital Management. The opinions are subject to change ...
more


