Is It Right To Be Bullish Near A Record Market High?
One outcome that comes from writing periodic content on our blog is we are held accountable for our various points of view whether they are right or wrong. No investor is going to be correct 100% of the time; however, being right more often than wrong enhances ones chance of better returns over the long run. So, as the S&P 500 Index is only 1.2% below its all time record closing high, being bullish now feels more difficult than being bullish this past February, after the market had declined nearly 12% to begin the year.
On February 27th of this year I published a post, Bearish Sentiment And Positive Uptick In Economic Reports May Translate To Higher Equity Prices, where I discussed reasons why higher equity prices were a most likely outcome. At that time individual and institutional sentiment measures were deeply bearish. In fact, an RBS economist said to sell everything in mid January after a large part of the early year equity decline already occurred. For our clients, we took advantage of the February equity market pullback to reposition some stock holdings in our client accounts and purchase companies we had an eye on, but believed a purchase at a lower price/valuation would come along and February provided that opportunity.
Today the market is near a record high, individual investor sentiment remains low, the U.S. economy is growing at a snails pace (less than 1.0%), Britain is contemplating exiting the Euro, debt issues in Greece remain unresolved, some retailers are losing out to online retail (Sports Authority files bankruptcy). Well you get the picture and I have only touched on a few issues facing economies around the world, but there does not seem to be a lack of bad news and anyone of those might be reason enough to sell equities, but we aren't at the moment.
Being bullish after a double digit market decline seems a lot easier than being bullish near market tops. Knowing the market does not move up or down in a straight line, are there factors we see that would support higher equity prices? In the intermediate and long run, we believe fundamental company and economic factors are key drivers of stock price returns.
From a fundamental company perspective, a few weeks ago we wrote about the potential for improved earnings, and a resumption of growth, as the year progresses. As the updated chart below shows, an improved earnings picture is something that would favor higher equity prices if the growth materializes. Reading the earlier post provides our point of view on why this seems a likely outcome.

In the short run though, technical market factors can impact equity price movements. A part of what drives this is the growth in computerized trading and the algorithms used by the trading programs. Technical chart patterns enable the algorithms to trade in and out of equities, for example, based on price targets generated by chart patterns.
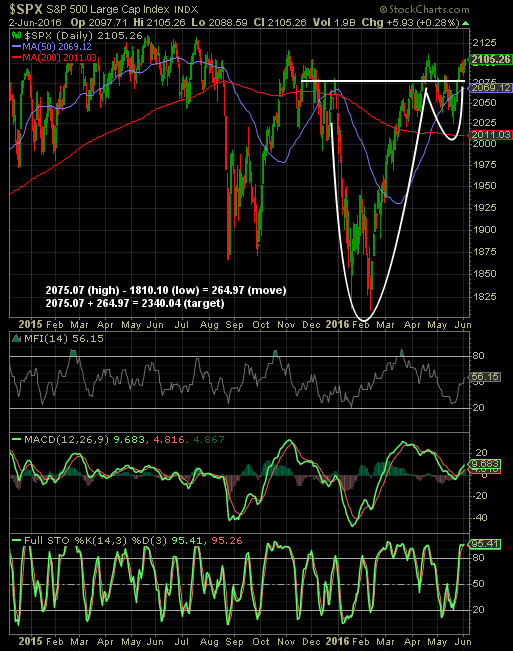
As the below technical chart of the S&P 500 Index shows, the chart pattern for this index has traced out a cup and handle chart pattern. The pattern has triggered as the index has moved through the line representing the cup top. The measured move target for the S&P 500 Index based on this pattern is 2,340.04. If the target price is realized, this is a mid-teens price increase for the Index. As coincidence would have it, the expected earnings growth rate approaches double digits as the year progresses. Of course, not every chart pattern that triggers will see follow through to the target; however, this is a favorable set up at a time the S&P 500 Index is near a market high.

Lastly, looking at individual investor bullish sentiment, it currently remains at a low level, i.e., 30.2%, and remains below the long term average level of 38.5%. In the weekly Sentiment Survey report released yesterday, bullish sentiment did show a rather large increase of 12.4 percentage points.

Source: AAII
Are there issues ahead that will result in an equity market pullback? Most likely. However, with the prospects of an improved earnings picture and a positive technical set up for the market, the S&P 500 Index may be set to finally breakaway to the upside and out of its nearly two year trading range. Leaning bullish at the moment, and near a market high, seems reasonable given the favorable technical and fundamental picture.
Disclosure: None.


