Huge Repo Warning
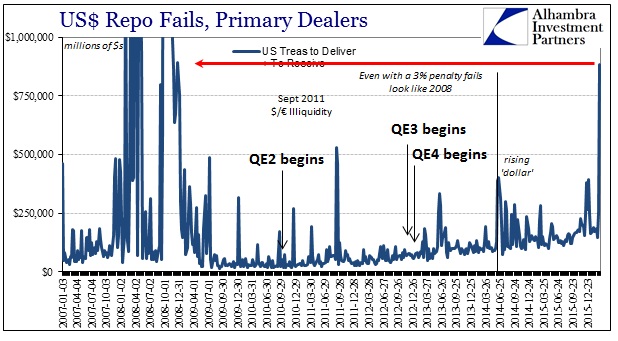
In the summer of 2014, repo fails suddenly surged out of nowhere. Between the events of the violent taper selloff in June 2013 and the first half of 2014, fails had been particularly calm if somewhat gently rising as the trend had it dating back to the QE’s. It had become common to find total fails (meaning both “to receive” plus “to deliver”) less than $100 billion. In fact, in the six weeks prior to the start of June 2014, fails had only been above $100 billion in one week and that was barely. The eight-week average was smack on the round number.
The week of June 4, fails jumped but not wholly out of character. At $130 billion, it was the highest since March 2014, but not really that much more than the $127 billion reported in mid-April. The following week, however, represented a clear shift in funding. Fails surged to $388 billion or the highest since the destructive days of September 2011. The week after that, June 18, fails jumped again, hitting $402.9 billion. They were more than $300 billion still the next week. Despite no looming event or obvious catalyst, it was clear that “something” had changed in repo funding, collateral in particular.
The “rising dollar” and the absolute peak in so many asset prices (the start of “deflation” and the slow trudge toward open economic disarray) began during all of this or very shortly thereafter. It was a clear warning sign.
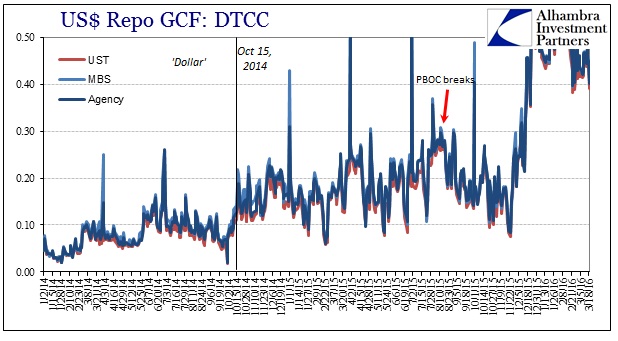
While fails would settle back down again somewhat, remaining still more volatile than prior to June 2014, GC rates never did. Throughout the “rising dollar” period, repo rates would find both an upward slope and increasing volatility. The peak in that respect came on August 12, 2015, notorious the day before in the PBOC being rocked by “dollar” pressures into sharply “devaluing” the CNY rate. Global liquidations were not far behind.

The fails issue would revisit again just before the end of 2015, in late December. Having nothing at all to do with Janet Yellen and the irrelevant FOMC, fails suddenly jumped to $380 billion the week of the FOMC decision before registering nearly $400 billion again the last week of last year. In what was another true testament of monetary policy failure, the Fed’s reverse repo program showed absolutely no disturbance whatsoever – no scramble to use the Fed’s vast SOMA holdings to fill in what was clearly a disruptive collateral gap.
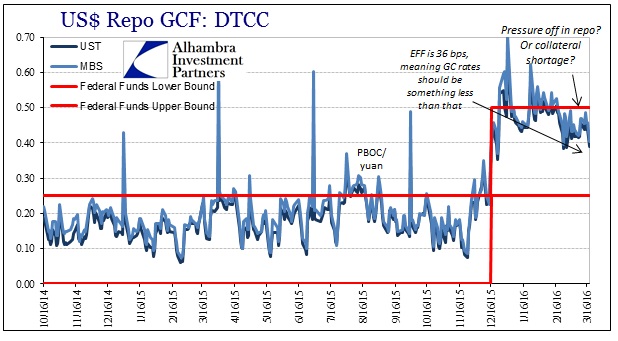
Not long after, of course, the January liquidations began even though repo fails settled once more into another unremarkable trend. Fails are like the crest of a mighty wave, announcing difficulties that may have been building underneath for some time as they are just about to break out into the open. As before, repo rates took center stage throughout the liquidations, as GC rates for some still unexplained reason remain at a positive spread to effective federal funds. In fact, for most of the liquidation period into February, GC rates traded often above the 50 bps money market “ceiling”, once more demonstrating how little hold monetary policy actually features.
The liquidations ending sometime around February 11 (subscription required), the vast majority of mainstream commentary rushed to claim that everything had passed, the storm had finally blown out to sea and normalcy had returned. There were still repo problems, however, as repo specials suddenly began to proliferate not just in multiple maturities but right on up to the -3% fails penalty rate. The 10-year was most affected, just as it was in June 2014. Reaching for a benign explanation, as always, media stories suggested it was nothing more than treasury shorts betting heavily (yet again) on Yellen’s recovery narrative and higher rates.
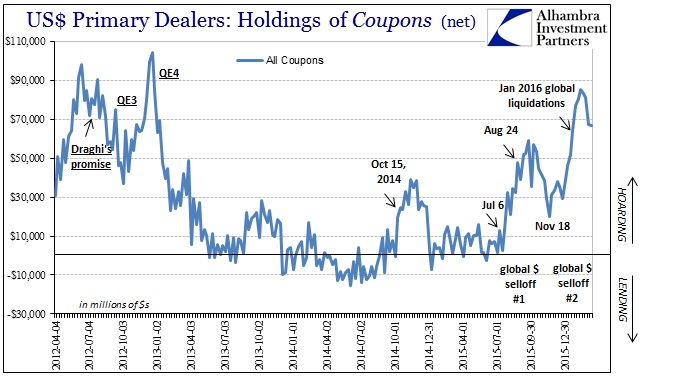
A more studious examination of repo, however, easily uncovered further problems with collateral as primary dealers had taken to hoarding again. They had started back before the January liquidations right in the turn toward them in November. The level of hoarding reached proportions last seen in the 2011 events, suggesting another angle as to the intensity of the January global selloff.


In pure repo terms, however, whatever might have triggered the hoarding it remained a constant condition; which could have only served to strain downstream collateral chains as rehypothecation undoubtedly was forced to adjust by this negative multiplier. Again, the Fed’s RRP has not just been absent but dismally, comically so. GC repo rates have come down of late, but that might be as much an indication of so many severe specials (cash “less valuable” than collateral on a relative basis) as an end to the huge mess.
The Fed’s updated fails estimates for the week of March 9 were going to be big given this backdrop, but the published estimate is far more than even I would have guessed. At $883 billion, that was more than double the flare in June 2014 and by far the worst collateral environment since the 2008 panic.

It is difficult to accept this level of fails as anything else other than a liquidity warning as all the prior versions had been. Again, it’s not like this was a surprise as there were so many indications of ongoing strain beneath the surface no matter what the outward appearance in other asset markets. It is the degree of fails that is most concerning, as it suggests a level of strain and restricted flow that is far more intense than anything we have experienced to this point. And it’s not like repo is the only indication of a desperate financial shortage.
In fact, that is the growing consensus among the deeper, internal eurodollar indications. From swap spreads to cross currency basis swaps to countries literally begging for dollars, they all point to the same imbalance – a dollar shortage. Repo collateral may not be dollars, but in interbank existence it often functions like currency, and in times of strain, like what we see here, collateral is more “currency” than cash.
It seems yet another warning that the financial world is “on the clock” to whatever it is that is working its way through the global system’s bowels. With a countdown already in place from whatever the PBOC had been doing in January (and this very well could be related to that), it would be truly a bad sign if those clocks synchronized especially heading into the final two weeks of a quarter and the typical window dressing illiquidity space. I would not be surprised at all if this surge in repo fails was the starter pistol firing to sound the beginning of dollar run #3. It won’t be apparent tomorrow; indeed, the data on fails is already more than a week stale. These things take time to work on through, as these sorts of esoteric imbalances methodically creep up from the depths in radiating ripples across funding and markets.
Disclosure: None.


I have been watching the Fed's reverse repo reports and was a little surprised to see all this going on with the reverse repos "undisturbed" as you put it. They have been making heavy use of this new "tool" since early 2014. Why are they not using it with this pretty dangerous looking gap? Will they use it now? I find it interesting that all this massive repo operation began about the same time that the big European banks began rolling over and breaking down technically - early to mid 2014. Does the Fed publish a repo fail chart like the one you show, or do you tabulate it?
Bruce, a question for you. Why don't the market monetarists, like Sumner, take into account the behavior of the primary dealers when determining the money supply?
One can never have enough good collateral to cover the crap collateral one offered in the beginning. :) More and more collateral is in the form of bonds, some highly rated and some not so highly rated.