Gold Forecast: August 2018
Gold prices settled at $1213.11 an ounce on Friday, falling 0.77% on the week. The prospect that rising U.S. interest rates will further support the dollar continued to weigh on the market, pushing gold down for the fourth week in a row. While President Donald Trump delivered a critique of the Federal Reserve last month, it didn’t knock the central bank off its gradual tightening path. The Federal Reserve’s latest policy statement suggested that the central bank is on track to increase borrowing costs in September. Despite a U.S.-China trade war that is escalating, money continues to flow into the U.S. stock market. That is also bearish for gold.
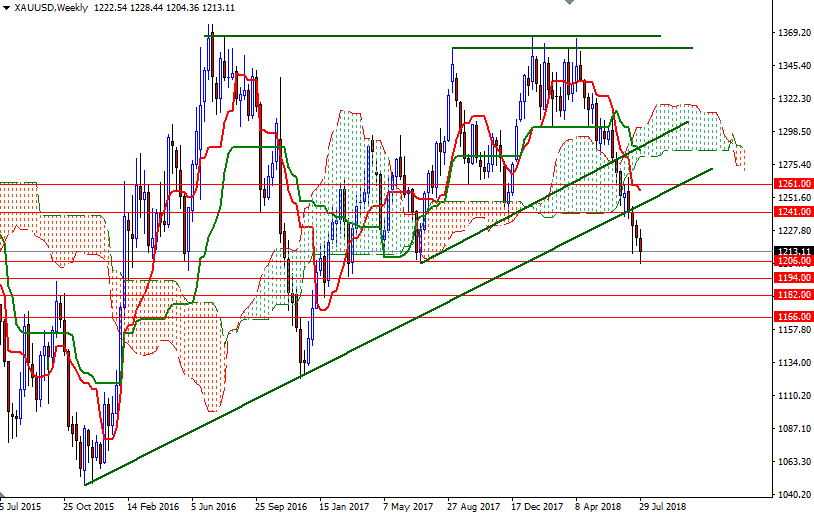
The market is trading below the weekly and the daily Ichimoku clouds. The Tenkan-sen (nine-period moving average, red line) and the Kijun-sen (twenty six-period moving average, green line) are negatively aligned. Adding to the bearish technical outlook is the Chikou-span (closing price plotted 26 periods behind, brown line), which is below the clouds on the weekly and the daily charts. Based on calculations (triangle breakout pattern), the bears’ first main goal is to reach the 1150/45 area. A sustained break below 1194 could offer enough inspiration for the bears to send prices lower. On its way down, support can be seen at 1182 and 1166.
(Click on image to enlarge)

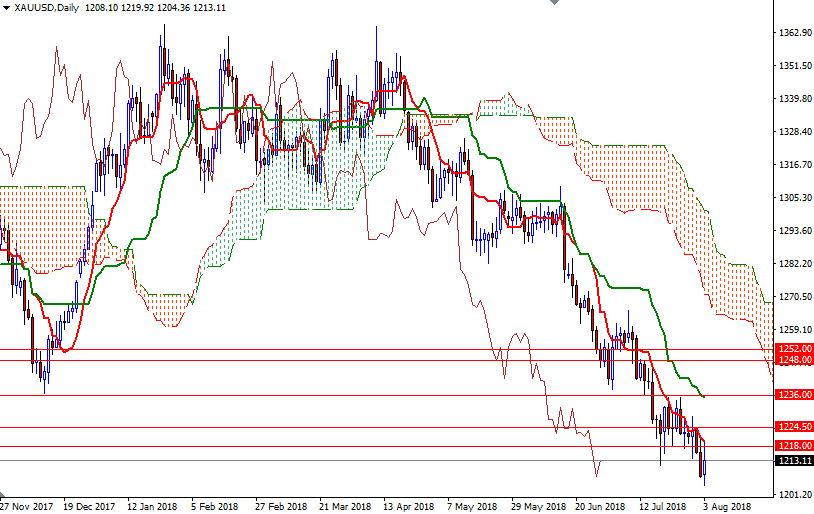
However, note that gold has shed 11% since prices peaked in April, and not too far from the current levels we have a strategic support in the 1200-1198 zone, where the bottom of the monthly Ichimoku cloud sits. In addition to that, the daily RSI is forming higher lows, creating a symmetrical triangle forming on the daily chart. If the support in the 1200-1198 zone remains intact, a corrective bounce towards the daily cloud wouldn’t be so surprising. The top of the 4-hourly cloud sits in the 1226-1224.50 zone so XAU/USD has to penetrate that barrier to challenge 1236. The bulls have to produce a daily close above 1236 to gain momentum for 1241 and 1252/48. Beyond there, the 1266/1 zone stands out as a solid technical resistance.
(Click on image to enlarge)

Disclaimer: DailyForex will not be held liable for any loss or damage resulting from reliance on the information contained within this website including market news, analysis, trading signals ...
more


