Futures Curve Now Suggests Far Less Recovery Than Early 2009
When the June 2018 eurodollar futures price touched above 98.50 on October 2, I thought that was an impressive bid suggesting just how much negativity had survived the August liquidations. It was interrupted by some backward optimism about China’s October Golden Week, but the eurodollar curve overall with the June 2018 maturity as a specific interaction point for monetary policy expectations against economic projection remained highly suspicious of either what the FOMC might do or what that might mean. Despite all the chatter of assured recovery and a rate hike that would initiate a series, that futures price never broke below 98.
Yesterday it received another impressive bid, finishing up an alarming 9 bps at 98.85. In other words, that point in the eurodollar curve has contradicted almost four quarter point rate hikes since threats of rate hikes turned serious. Almost all of that has occurred in 2016 right alongside the global liquidations and upset. In that sense, it is as I suggested earlier today with dealer hoarding of UST coupons; namely a window into the hidden mass of eurodollar liquidity that isn’t ever represented easily in one price or indication. The idea of the “rising dollar” can only be determined by corroborative cooperation:

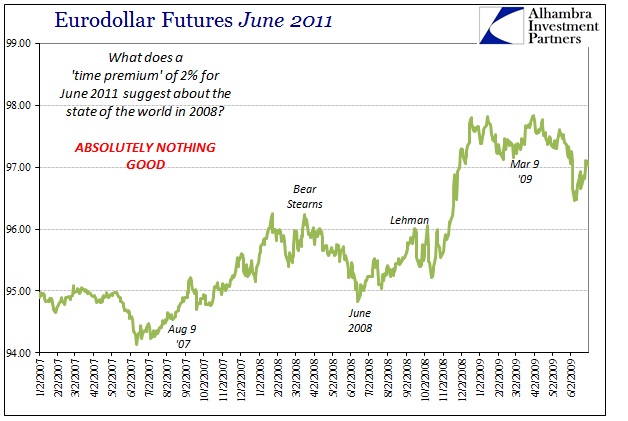
The interpretation of 1% or so money rates for June 2018 (implied 3-month LIBOR) is only highly negative – distressingly so. In fact, if you go back to the June 2011 eurodollar contract it was trading in the same direction (with greater magnitude of traversal) but never even got to 98. Obviously, the starting price of that contract was much less given monetary expectations of that time, but the eurodollar curve by the end of the 2008 was similarly depressed though with some residual steepening about 100 bps or so more than now.

That meant by February 2009, the eurodollar curve was suggesting about 2.5% in money rates two and a quarter years forward. In February 2016, the eurodollar curve is suggesting just 1.15% money rates for the same forward time into the middle of 2018. That is certainly the nature of ZIRP but it also, I think, speaks to experience in these kinds of matters where central bank promises are now fully tested. Even in the wreckage of 2008 and its aftermath (which was still ongoing in February 2009) there was significantly more faith about the state of the world by the middle of 2011, even if that was itself significantly less than what was being priced back when Bear Stearns had failed (4% rates by June 2011) less than a year before. Ironically, it was the events of June and July 2011 that I believe served to begin this decay (both eurodollar function and faith in central banks) we see still in effect now.
The confirmation of unease and concern, then, extends both in current circumstances and when compared to the history of money markets across somewhat similar time periods. There just isn’t anything positive about funding conditions now and more so what that means in terms expectations for the immediate and intermediate future. There isn’t even the limited optimism of early 2009, and, as recent trading suggests, we still don’t have an idea of how much monetary compression (and related illiquidity) is left.


Disclosure: NOTE: none of this commentary is intended or should be viewed as offering investment advice about Capital One or FHLB securities in any form. This is ...
more


