EIA Report Shows No Sign Yet Of U.S. Production Cuts

U.S. Production
The EIA report came out on Wednesday and the first thing that I look for, and really the only data point that matters for meaningful progress towards the market rebalancing is has U.S. Production started to decline. Well it hasn`t as last week we were at 9.219 million barrels per day, and this week we got 9.227 barrels per day, and this is slightly more than a year ago where we had 9.192 million barrels per day. Thus we are treading water for about a year at this 9.2 million barrels per day level, but that just isn`t going to cut it considering the drop in spot prices of crude oil. These guys are literally brain dead, even cars at auction have a reserve price. Apparently crude oil has no reserve price, they will sell it for $5 at this rate. At some point this data metric is going to drop like a rock, but it isn`t this week.

Oil Inventories
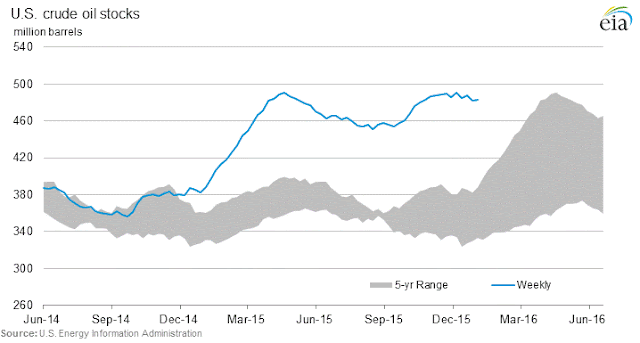
The next thing I look at is crude inventories and they seem to be stabilizing, probably because of the oil exporting ban being lifted to some extent. But I am still expecting some 10 million barrel weekly builds around maintenance season, as we had several 10 million type weekly builds last year around this time. We are basically flat for the week at 482.6 million barrels in storage, with Cushing at 64 million barrels in storage, and the gulf coast at 236.6 million barrels in storage, down about three million barrels on the week due to increased exports I am guessing as refinery inputs were nothing to write home about down about 200,000 barrels per day from the previous week at 8.562 from 8.775.
Gasoline Stocks
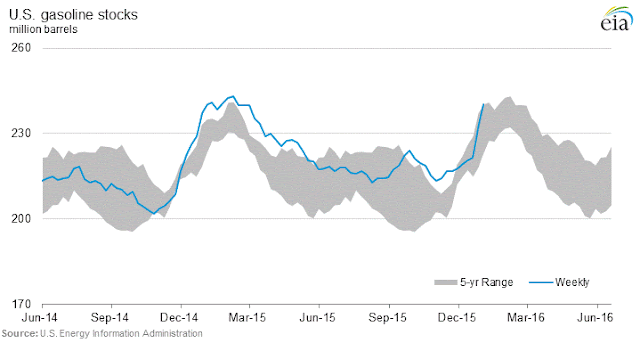
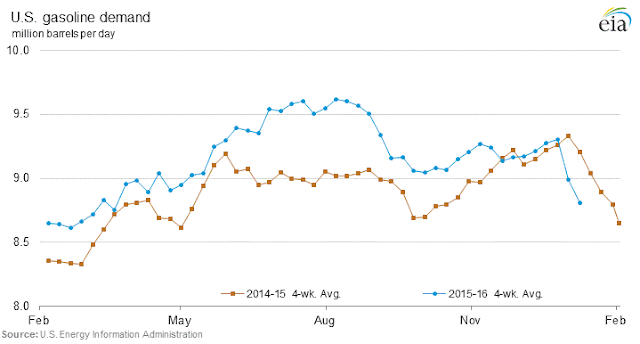
The most striking part of the report was the build in products for the second week in a row, not sure what is going on here. But these builds seem a little odd, I cannot place my finger on it, but gasoline stocks have round tripped to 240.4 which matches where they were a year ago at 240.3 which looks like a double top on the charts. Of course gasoline prices are much lower this time around at 1.128 this year and 1.323 this time last year, almost a 20 cent difference and nearly the exact same level of stocks. Gasoline demand has dropped versus last year but this is a noisy number and I am not reading too much into this data point right now as we were at 8.159 for the first week, this week we did 8.500 million barrels per day of gasoline demand, and this time last year we were at 8.875 million barrels per day on average for the week.
Distillate Stocks
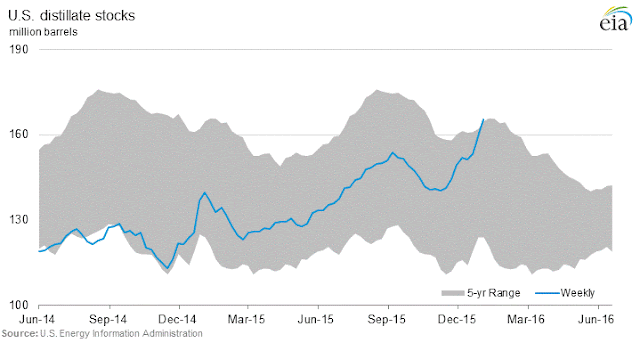
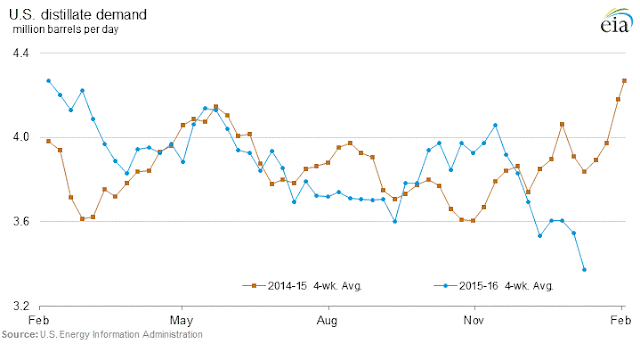
In regard to Distillate stocks we are at 165.6 million barrels, up last week from 159.4 million barrels, and of course both product`s charts look like they are going to break out. This is to be expected with the overall mild weather winter so far, thereby reducing heating oil demand. It is rather telling in comparing the distillate demand on the chart for this time last year with this year. For example last year we were at 3.943 million barrels per day, and this year we are at 2.832 million barrels per day. That is more than 1 million barrels per day difference in demand, quite striking, but again this number moves around a lot depending upon several factors from week to week. For example, just two weeks ago we were at 3.633 million barrels per day for distillate demand.
Conclusion
My biggest takeaway is that the Shale community is in major denial right now. They are so distorted from reality that it is like Enron right before the crash when they were doing barge deals with Merrill Lynch to make their debt seem better by being hidden off the balance sheets. Something bizarre is going on in the Shale world as we should be seeing major cutbacks in shale production at $30 a barrel oil. At any rate, the drop didn`t come this week. We will wait for the next EIA report for signs of this expected drop in U.S. Production that we think is coming down the pike.
Disclaimer: All of the content on EconMatters is provided without assurance or warranty of any kind. The opinions expressed here are personal views only, and ...
more


