Economic Outlook 2015, Part 1: Lagging Indicators Show Growth In 2014 Aided By Low Interest Rates And Increasing Consumer Debt
It’s the time of the year to reflect on the direction of the economy. For the past several years I have examined each individual component of The Conference Board’s Lagging, Coincident and Leading Economic Indicators and created my own diffusion index by ranking each indicator -1, 0 or +1. I have found that this method produces accurate forecasts of future economic conditions. In 2013 I predicted a continuation of sluggish growth ahead of virtually everyone else (link here), and in 2014 I reversed that call and predicted faster growth (link here), which also turned out to be correct. Thus far in 2014 GDP growth has been higher than any year since the 2008 financial crisis, which can be seen in the following graph.

I’ll break this year’s forecast into 3 parts. Part 1 will cover The Conference Board’s 7 Lagging Indicators, which help us look back and understand how economic activity evolved over the past 6-12 months (I will cover the Coincident and Leading Indicators later this week). I find that the Lagging Indicators are most useful for corroborating previous forecasts and identifying the main factors that contributed to growth in previous periods.
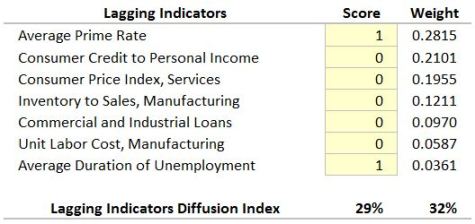
The following table shows my rankings for each lagging indicator. While no indicator is flashing a negative signal (corresponding to a score of -1), I scored most of them zero rather than +1, as the evidence strongly suggests that GDP growth in 2014 was dependent upon artificially low interest rates and further increases in consumer debt loads, which were already high.

Sluggish wage growth and an elevated services CPI (which tends to rise in the early stages of an economic slowdown) cast further doubt on whether 2015 can match or exceed the growth we’ve seen in 2014. The diffusion index scores of 29% and 32% (equally weighted and using The Conference Board’s weights, respectively) reflect my view that although economic growth was positive, economic momentum remains surprisingly tepid. The economy may have difficulty sustaining its recent performance all the way through 2015. A detailed analysis of each lagging indicator follows below.
The most heavily-weighted lagging indicator is the Average Prime Rate (weight = 0.2815), also shown with Total Commercial and Industrial Loans. The rate has never been lower, and commercial and industrial loans continue increasing, so this indicator merits a score of +1.

Next is the Ratio of Consumer Credit to Personal Income (weight = 0.2101), also shown with Personal Income Less Transfer Payments, which provides an additional perspective on sources of consumer spending power. It strikes me that the credit-to-income ratio is a “goldilocks” number, in that we don’t want it to be too high or too low. The ratio recently exceeded its 2003 high, which tells us that consumers feel it is necessary to manage ever-larger debt loads, despite the steady gains in Personal Income from non-Transfer Payment sources, as shown in the graph. I will therefore rate this indicator zero, as growing household debt loads are a potential source of financial instability — especially if interest rates were to rise.

The next Lagging Indicator is the Consumer Price Index for Services (weight = 0.1955). The Conference Board describes the interpretation of this indicator: “It is probable that . . . service sector inflation tends to increase in the initial months of a recession and to decrease in the initial months of an expansion.” Recent increases in this indicator therefore bear watching — any further uptrend would be concerning, as increases in the index are associated with recessions (although not always with a lag). I will therefore rate this indicator zero.

Ratio of Inventory to Sales (weight = 0.1211). With the prevalence of just-in-time inventory management, this ratio has trended downwards for decades. Recently there are signs of a gradual buildup in inventories, however, so this indicator earns a score of zero.

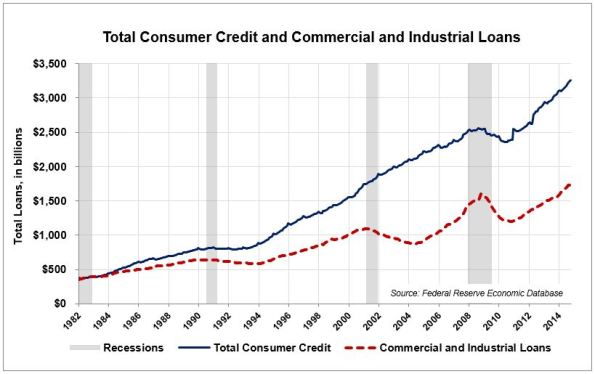
Commercial and Industrial Loans (weight = 0.0970) are shown below. Consumer credit is rising almost asymptotically, while industrial loans are increasing at a saner rate. This pattern of rapidly increasing consumer credit suggests that economic growth and spending are dependent on increasing debt levels, so I will also have to rate this indicator zero.

Nominal and Real Unit Labor Costs (weight = 0.0587) are shown in the graph below. Sluggish job creation has helped businesses keep labor costs capped — good for business, bad for working class consumers. After deflating unit labor costs by the chained PCE, we see that the trend has been negative for 12 years — in other words, “labor costs” (wages and salaries to workers) have not kept up with the rate of inflation, which tells us why consumers have been increasing their debt loads. The “good for business, bad for working class consumers” story causes me to rate this indicator zero.

Median Duration of Unemployment (weight = 0.0361) is shown below, along with the Civilian Labor Force Participation Rate. Unemployment duration continues improving, down to a median 13 weeks (which is still elevated compared with previous business cycles). The decline in the labor force participation rate has slowed, but is not trending upward. I can coax a +1 out of this indicator, but I might be rounding up from +0.5 — the labor market simply is still a far cry from what it used to be in the U.S.

Taken together, the lagging indicators generally confirm that 2014 was a positive year for economic activity and GDP growth. I have concerns regarding the sustainability of real GDP growth in the 3.5%-4.0% range, however, due mainly to the following factors:
- artificially low interest rates,
- increasing consumer debt,
- wage growth below the rate of inflation, and
- a rising services CPI.
My next installment in this year’s economic outlook will cover The Conference Board’s Coincident Economic Indicators.


