Commitment Of Traders: Crude Confounding Confusion
The price of oil can’t seem to climb out of the $40’s despite a lot going for it at the moment. Oil prices matter right now as much as three years ago when they signaled serious trouble ahead. For them to get above $50 and then continue on would indicate for a lot of important places what everyone has expected of “reflation.”
That would be true for inflation rates as well as other pessimistic prices like eurodollar futures and UST yields. Crude oil isn’t strictly a perception to be traded. There is black gold all over the world that is moved around, stored, and ultimately used. It is the intersection of finance and economy, the very real economic check of financial, sometimes monetary assumptions.
The primary problem for the oil market is and has been inventory. The monetary expectations for QE brought back $100 oil (just as erroneous monetary expectations for the Fed overdoing it in 2007 and early 2008 first brought about $100 oil) and with it the shale boom. Oil supply rose sharply but then in 2014 demand suddenly softened followed by harsher reductions. The result was a pile of inventory that lingers three years later.
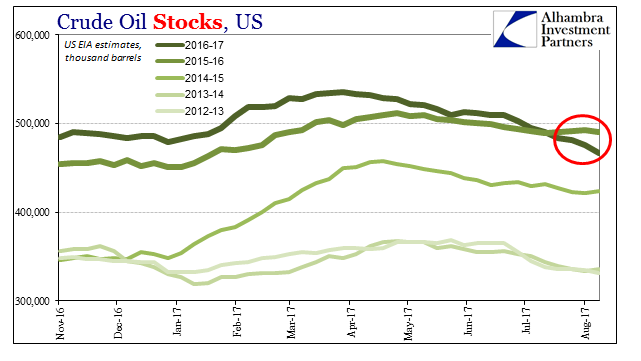
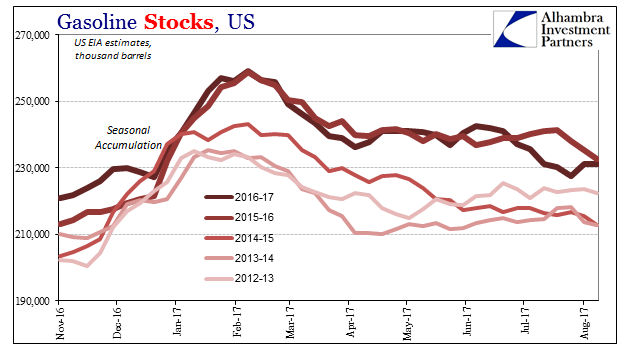
Producers adjusted and the economy improved, or at least stopped getting worse, meaning that oil demand has come back for that lower supply. Inventories are finally being drawn down. The pace of it is debatable, but in recent weeks at least there is less oil in the US sitting around than at the same time last year. Progress can be measured for many in such small steps (gasoline, however, is another story).
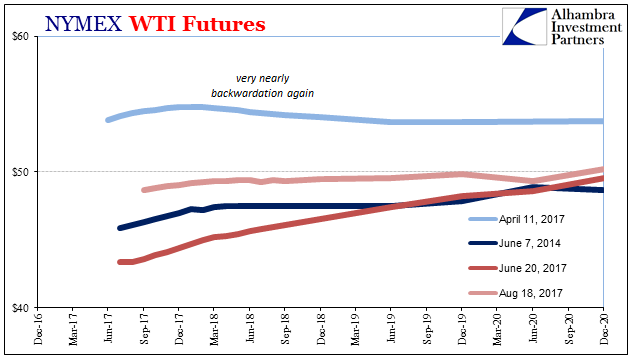
In my view it isn’t all that encouraging, but to many others it is. The oil futures market next to UST’s is perhaps the deepest and most crucial. As of the latest weekly Commitment of Traders Report (COT), open interest was 2.2 million contracts representing 2.2 billion barrels of crude oil.
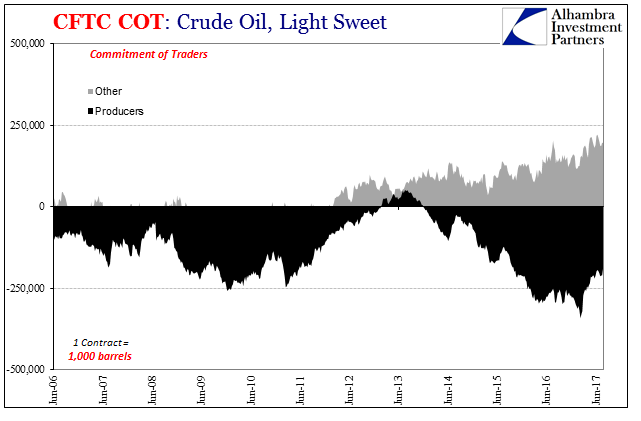
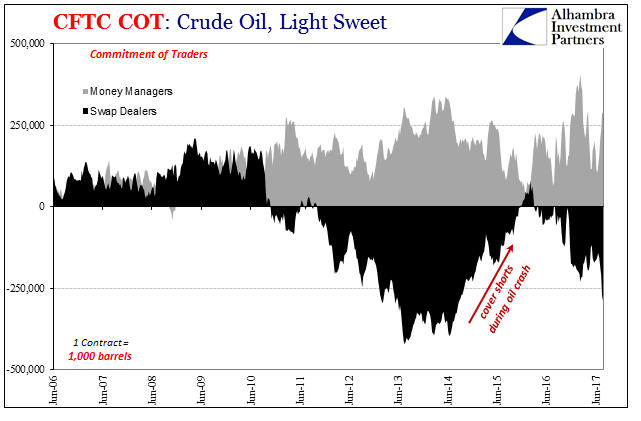
The crude oil futures market is essentially four different segments. Like the futures market for US Treasuries, a lot has changed since 2011. Swap dealers were once as long as Money Managers, but now are essentially the other side of them. Similarly, the “other” category of futures traders (includes speculators) has become something of an offset to the producers. It is for this last segment that these futures markets were originally intended, as a place for production hedging via forward (future) sales.
Overall, the net positions among the four groups largely balance, with a slightly short bias befitting backwardation. There isn’t ever a whole lot net long or short, at most 50,000 contracts at more extreme time periods (and as in other futures markets in the “wrong” direction; meaning that the overall position will likely be net short during a period of rising prices harkening back to the goal of these markets as a hedging instrument).

By and large, however, the price of oil in the US (WTI) follows the Money Managers. These are persistently long positions if of varying degrees. It’s not so much the tail wagging the dog as it is fundamentals plus liquidity, the exact characteristics that make the futures market so vital.

There are a couple of periods that stand out, however, where it is clear that market clearing prices are determined by factors beyond the mood/margins of Money Managers. Those happen to be both of the periods in question, the original crash in oil prices as well as the more recent failure to further rebound.

During the initial “rising dollar” difficulties, Money Managers cut back their longs but only in July and August 2014. They held onto them throughout the crash, very likely because they (literally) bought the “supply glut” thesis. It wasn’t until the second crash starting in the summer of 2015 that they began to seriously pare back, getting almost to neutral by early January 2016 neutral (just 36k net long). Small wonder the ultimately low was below $30 and the futures curve so far in contango, so little was the buying support.
It was the swap dealers who were cutting back their shorts , covering their hedges as oil prices crashed into early 2015 (sapping liquidity). As a result, the whole market net position started to go long, a contrary indication of finance plus fundamentals.

In November 2016, Money Managers went huge long oil consistent with “reflation” fever, driving their positions to a net record high by the middle of February this year. Yet, WTI did not follow like might have been expected under previous circumstances. Instead, oil prices rose if ever so gently and then began what remains a lower trend. In this instance, dealers increased their short positions but not nearly as enthusiastically as the Money Managers on the long side.
The result again was a shift in the whole market to net long, where in the weeks since middle February it has tended to do – and is therefore a drag on the WTI futures curve despite what seems to be taken more generally as positive trends.
The primary reason for this market shift since February, however, might be something of a surprise. The Money Managers since late June have rebuilt their long positions (if not yet quite as extreme as earlier this year) with WTI turning higher June 21 after appearing set for less than $40 again. The price did not go that much higher, however, though not because of the Swap Dealers this time.
The Dealers have pushed heavily short in the past five weeks, which all should be price positive in a balanced futures market. It has been the Producers instead who have failed to match these moves, creating a state instead of imbalance. They have cut back their short side and not just recently – going back to the week of February 21 when WTI stopped rising.


It doesn’t seem to make much sense, as fewer short contracts would seem to indicate Producers being more confident about the future oil prices. If they are hedging less, it would stand to reason it is because they feel as if they don’t have to.
The likely reason for this shift, however, is probably a big surprise. Producers are cutting back, and hurting the oil price, because they have less oil to hedge. The level of their hedging activity fits almost perfectly with the trend in oil inventories. They cut back in February in anticipation of lower crude stocks as has occurred.

So how does what would be a positive result and a potentially bullish signal turn into a drag on the futures market? This is where, I believe, liquidity comes in. There should be a balancing factor somewhere else in the market to keep it from going (counterintuitively) net long overall. But there isn’t, the absence notable for either dealers or speculators. Something is preventing a balanced market, which is slightly net short in total for a rising oil price.
This can have real world implications, where the lack of further price increase forces futures liquidations again (as the three times since February 23) as well as economic adjustments more broadly (given the importance of oil prices in telling economic as well as financial agents the real score in the real economy that economists and their forecasts can’t). We may have already seen those in action (lack of economic momentum and acceleration due almost certainly to increased caution and uncertainty despite otherwise “reflation” sentiment).
Liquidity matters, which is why we follow these things to obsessive degrees. It matters in small details like repo collateral and dealer hoarding, and it matters for the big things like portfolio management and macro forecasting (defining risks). If this continues, count the FOMC already for more confused debates about “rate hikes” that don’t hike rates.
Disclosure: This material has been distributed fo or informational purposes only. It is the opinion of the author and should not be considered as investment advice or a recommendation of any ...
more


