
Career Education Corp. Is A Strong Buy
Our leader is the same as in mid-August--FivePrime Therapeutics. Since we provided data and a free stock report on that company already, this week we will focus on another top-ranked 5-Engine STRONG BUY, Career Education Corporation (CECO).
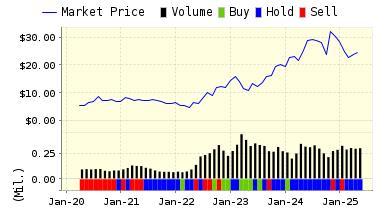
Career Education Corporation (CECO) is a provider of private, for-profit post-secondary education with campuses throughout the United States and Canada, the United Kingdom and the United Arab Emirates. Their schools enjoy long operating histories and offer a variety of master's degree, bachelor's degree, associate degree, and diploma programs in career-oriented disciplines. They offer educational programs principally in the following four career-related fields of study, Visual Communication and Design Technologies, Information Technology, Business Studies, and Culinary Arts.
Recommendation: We continue with our STRONG BUY recommendation on Career Education Corporation for 2016-08-29. Based on the information we have gathered and our resulting research, we feel that Career Education Corporation has the probability to OUTPERFORM average market performance for the next year. The company exhibits ATTRACTIVE P/E Ratio and Momentum.
|
ValuEngine Forecast |
||
|
Target |
Expected |
|
|---|---|---|
|
1-Month |
6.86 | 1.59% |
|
3-Month |
7.01 | 3.86% |
|
6-Month |
7.10 | 5.24% |
|
1-Year |
8.05 | 19.30% |
|
2-Year |
7.24 | 7.20% |
|
3-Year |
6.60 | -2.26% |
|
Valuation & Rankings |
|||
|
Valuation |
3.24% undervalued |
Valuation Rank |
|
|
1-M Forecast Return |
1.59% |
1-M Forecast Return Rank |
|
|
12-M Return |
78.57% |
Momentum Rank |
|
|
Sharpe Ratio |
-0.30 |
Sharpe Ratio Rank |
|
|
5-Y Avg Annual Return |
-23.78% |
5-Y Avg Annual Rtn Rank |
|
|
Volatility |
79.71% |
Volatility Rank |
|
|
Expected EPS Growth |
-104.79% |
EPS Growth Rank |
|
|
Market Cap (billions) |
0.45 |
Size Rank |
|
|
Trailing P/E Ratio |
3.13 |
Trailing P/E Rank |
|
|
Forward P/E Ratio |
n/a |
Forward P/E Ratio Rank |
|
|
PEG Ratio |
n/a |
PEG Ratio Rank |
|
|
Price/Sales |
0.52 |
Price/Sales Rank |
|
|
Market/Book |
1.76 |
Market/Book Rank |
|
|
Beta |
2.49 |
Beta Rank |
|
|
Alpha |
0.69 |
Alpha Rank |
|
Market Overview
|
Summary of VE Stock Universe |
|
|
Stocks Undervalued |
52.25% |
|
Stocks Overvalued |
47.75% |
|
Stocks Undervalued by 20% |
21.72% |
|
Stocks Overvalued by 20% |
15.34% |
Sector Overview
|
Sector |
Change |
MTD |
YTD |
Valuation |
Last 12-MReturn |
P/E Ratio |
|
Multi-Sector Conglomerates |
0.20% |
2.03% |
9.51% |
12.95% overvalued |
5.64% |
20.79 |
|
Consumer Staples |
0.34% |
1.68% |
10.99% |
10.08% overvalued |
13.28% |
24.01 |
|
Industrial Products |
0.34% |
3.31% |
16.70% |
7.27% overvalued |
9.44% |
23.21 |
|
Basic Materials |
1.10% |
-0.10% |
47.93% |
6.96% overvalued |
57.53% |
32.48 |
|
Aerospace |
0.53% |
1.42% |
0.83% |
2.76% overvalued |
1.53% |
19.44 |
|
Computer and Technology |
0.37% |
3.36% |
15.21% |
2.38% overvalued |
8.44% |
29.18 |
|
Utilities |
0.62% |
-2.32% |
11.50% |
2.06% overvalued |
13.23% |
22.12 |
|
Oils-Energy |
0.59% |
3.09% |
16.82% |
1.08% overvalued |
-7.63% |
25.54 |
|
Finance |
0.39% |
2.39% |
6.91% |
0.53% overvalued |
4.76% |
16.25 |
|
Construction |
0.39% |
0.78% |
29.98% |
0.84% undervalued |
14.59% |
21.42 |
|
Consumer Discretionary |
0.25% |
1.54% |
9.08% |
1.53% undervalued |
-0.40% |
23.64 |
|
Transportation |
-0.11% |
-0.25% |
10.78% |
2.46% undervalued |
-14.77% |
14.62 |
|
Business Services |
0.28% |
0.97% |
14.16% |
5.68% undervalued |
1.70% |
24.79 |
|
Auto-Tires-Trucks |
0.28% |
1.77% |
4.44% |
8.02% undervalued |
2.72% |
16.50 |
|
Retail-Wholesale |
0.36% |
1.90% |
2.35% |
8.97% undervalued |
-3.27% |
23.36 |
|
Medical |
0.68% |
-0.72% |
0.70% |
10.40% undervalued |
-13.86% |
27.88 |
Valuation Wath: Overvalued stocks now make up 47.75% of our stocks assigned a valuation and 15.34% of those equities are calculated to be overvalued by 20% or more. Nine sectors are calculated to be overvalued.
Disclaimer: ValuEngine.com is an independent research ...
more

