
Best Buy Is Our Top Upgrade This Week
For today's bulletin we used our website's advanced screening functions to search for UPGRADES to BUY or STRONG BUY with complete forecast and valuation data.* They are presented by one-month forecast return. Best Buy (BBY) is our top-rated upgrade this week.
|
Ticker |
Company Name |
Market Price |
Valuation |
Last 12-M Return |
1-M Forecast Return |
1-Yr Forecast Return |
P/E Ratio |
Sector Name |
|
BEST BUY |
33.6 |
4.91% |
4.61% |
0.54% |
6.48% |
11.90 |
Retail-Wholesale |
|
|
MB FINANCL INC |
38.39 |
3.83% |
13.35% |
0.52% |
6.26% |
17.53 |
Finance |
|
|
MKS INSTRUMENTS |
45.68 |
-0.56% |
30.14% |
0.61% |
7.27% |
22.50 |
Computer and Technology |
|
|
DATALINK CORP |
8.58 |
-5.66% |
23.81% |
0.78% |
9.30% |
18.65 |
Computer and Technology |
|
|
MEDIVATION INC |
63.99 |
-46.93% |
33.67% |
0.51% |
6.08% |
84.20 |
Medical |
*Note: These picks are all rated "BUY." There are no "STRONG BUY" rated upgrades for today.
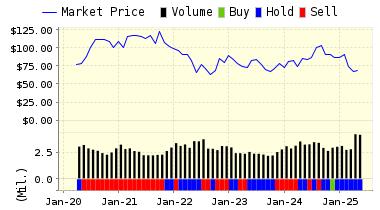
Below is today's data on Best Buy (BBY):
Best Buy operates in a single business segment, selling personal computers and other home office products, consumer electronics, entertainment software, major appliances and related accessories principally through its retail stores. They operate retail stores and commercial Websites under the brand names Best Buy, Media Play, On Cue, Sam Goody, Suncoast, Magnolia Hi-Fi and Future Shop. They also operate in three segments: Best Buy, Musicland and International.
VALUENGINE RECOMMENDATION: ValuEngine updated its recommendation from HOLD to BUY for BEST BUY on 2016-07-29. Based on the information we have gathered and our resulting research, we feel that BEST BUY has the probability to OUTPERFORM average market performance for the next year. The company exhibits ATTRACTIVE Company Size and Price Sales Ratio.
|
ValuEngine Forecast |
||
|
Target |
Expected |
|
|---|---|---|
|
1-Month |
33.78 | 0.54% |
|
3-Month |
34.60 | 2.98% |
|
6-Month |
35.41 | 5.40% |
|
1-Year |
35.78 | 6.48% |
|
2-Year |
40.06 | 19.22% |
|
3-Year |
39.61 | 17.89% |
|
Valuation & Rankings |
|||
|
Valuation |
4.91% overvalued |
Valuation Rank(?) |
|
|
1-M Forecast Return |
0.54% |
1-M Forecast Return Rank |
|
|
12-M Return |
4.61% |
Momentum Rank(?) |
|
|
Sharpe Ratio |
-0.01 |
Sharpe Ratio Rank(?) |
|
|
5-Y Avg Annual Return |
-0.52% |
5-Y Avg Annual Rtn Rank |
|
|
Volatility |
42.84% |
Volatility Rank(?) |
|
|
Expected EPS Growth |
3.42% |
EPS Growth Rank(?) |
|
|
Market Cap (billions) |
11.79 |
Size Rank |
|
|
Trailing P/E Ratio |
11.90 |
Trailing P/E Rank(?) |
|
|
Forward P/E Ratio |
11.51 |
Forward P/E Ratio Rank |
|
|
PEG Ratio |
3.48 |
PEG Ratio Rank |
|
|
Price/Sales |
0.30 |
Price/Sales Rank(?) |
|
|
Market/Book |
2.96 |
Market/Book Rank(?) |
|
|
Beta |
1.52 |
Beta Rank |
|
|
Alpha |
-0.09 |
Alpha Rank |
|
ValuEngine Market Overview
|
Summary of VE Stock Universe |
|
|
Stocks Undervalued |
55.3% |
|
Stocks Overvalued |
44.7% |
|
Stocks Undervalued by 20% |
24.1% |
|
Stocks Overvalued by 20% |
15.43% |
ValuEngine Sector Overview
|
Sector |
Change |
MTD |
YTD |
Valuation |
Last 12-MReturn |
P/E Ratio |
|
-0.08% |
8.22% |
51.32% |
17.38% overvalued |
56.86% |
31.31 |
|
|
-0.06% |
1.87% |
9.40% |
7.46% overvalued |
8.98% |
24.43 |
|
|
-0.40% |
1.90% |
12.92% |
5.83% overvalued |
11.77% |
23.62 |
|
|
0.20% |
3.10% |
7.16% |
3.31% overvalued |
-6.81% |
18.68 |
|
|
-0.74% |
5.36% |
10.91% |
0.99% overvalued |
3.93% |
22.34 |
|
|
-0.24% |
3.68% |
-2.40% |
0.00% undervalued |
-4.11% |
19.28 |
|
|
-0.24% |
5.25% |
11.40% |
1.09% undervalued |
1.60% |
29.85 |
|
|
-0.32% |
3.66% |
14.42% |
1.50% undervalued |
-4.52% |
22.91 |
|
|
0.46% |
7.90% |
29.17% |
1.57% undervalued |
7.25% |
21.97 |
|
|
-0.01% |
3.80% |
5.11% |
2.34% undervalued |
-0.32% |
16.45 |
|
|
0.04% |
4.50% |
6.66% |
3.55% undervalued |
-4.40% |
22.66 |
|
|
-0.31% |
-1.52% |
13.78% |
4.42% undervalued |
-17.52% |
24.31 |
|
|
-0.04% |
6.19% |
1.11% |
8.39% undervalued |
-20.15% |
28.35 |
|
|
0.04% |
3.65% |
0.42% |
8.72% undervalued |
-6.29% |
22.32 |
|
|
0.10% |
6.59% |
7.45% |
8.82% undervalued |
-21.60% |
14.58 |
|
|
-0.86% |
6.69% |
1.08% |
14.85% undervalued |
-5.21% |
12.74 |
Disclosure: None.
Disclaimer: ValuEngine.com is an independent research provider, producing buy/hold/sell recommendations, ...
more

