Are Recent S&P 500 Returns Excessive? Part II
Last week I reviewed US stock-market returns in context with recent history for perspective on deciding if the latest bull run is extreme. The results suggest that current trailing performance for one and three years was impressive but not yet off the charts. The caveat is that the analysis focused on the last quarter century using a proxy ETF. Will the results change if we use a much longer data set?
Let’s see how the numbers compare when we tap into Professor Shiller’s S&P 500 database. The start date for this test is 1900 with a monthly frequency – 117 years of market history.
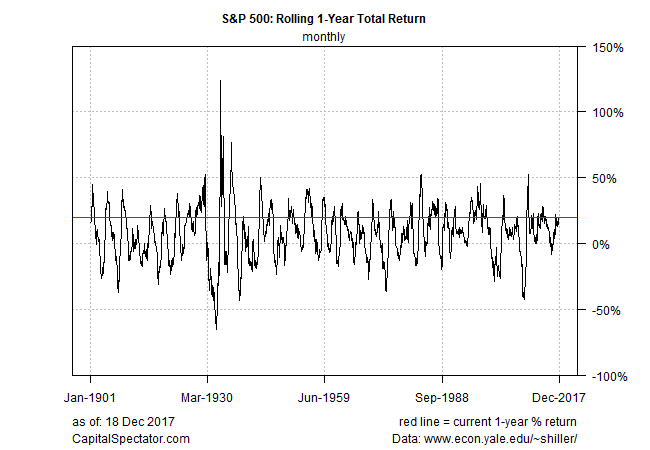
The first chart shows rolling one-year S&P 500 returns since 1901, with the current annual change — 19.7% — shown by the red line. A nearly 20% annual return is high, but well short of the extreme gains shown in history. The median one-year performance since 1901 is roughly 8.5%, or less than half the current one-year change. In other words, the latest one-year advance is close to the 75th percentile relative to the past century-plus. One-year gains have been higher, but the current advance is clearly in the upper ranges of the historical record.

For a less noisy time frame let’s turn to rolling 10-year annualized returns. The current gain is 6.2%, which is roughly at the 58% percentile. In other words, the S&P’s current 10-year advance is modestly above its median result for the past century-plus. That alone is no guarantee that the 10-year return will edge higher, but history implies that there’s still ample room for stronger performance for this time window.

For another perspective, let’s translate the rolling 10-year returns into Z-scores, which converts the performance history to a scale that shows how performance ranks as standard deviations from the historical mean. On that score, the S&P’s current results are quite close to average, which tells us that recent performance is more or less “normal”.

The main takeaway: one-year returns look elevated, but the 10-year performance looks more or less average. Nonetheless, it would hardly be shocking to see a pullback in the near term after the recent bull run. Note, too, that the equity market’s valuation is elevated, according to several metrics.
Matt Maley, a strategist at Miller Tabak, warns that the market’s entering “precarious territory” and is “very, very overbought.”
The current one-year rise lends support to that analysis, although the 10-year return still looks middling. The implication: investors with a short-to-medium-term horizon may want to tread cautiously while risk appears to be a bit lower for those with a longer-term outlook.
Disclosure: None.


