
Aegion Corp. Leads Top-Five Upgrade List

Data are presented by one-month forecast return. Aegion Corp (AEGN) is the leader here.
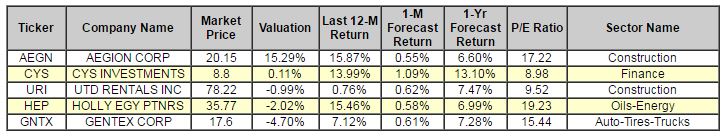
Aegion Corporation provides cured-in place pipe and other technologies and services for the rehabilitation of pipeline systems. The Company is engaged in providing proprietary technologies and services to protect against the corrosion of industrial pipelines and for the rehabilitation and strengthening of sewer, water, energy and mining piping systems and buildings, bridges, tunnels and waterfront structures. Aegion Corporation, formally known as Insituform Technologies, Inc., is headquartered in Chesterfield, Missouri.*Note: These picks are all rated "BUY." There are no "STRONG BUY" rated upgrades for today.
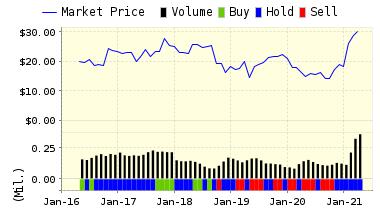
Below is today's data on Aegion Corp (AEGN):
Recommendation: We updated our recommendation from HOLD to BUY for AEGION CORP on 2016-07-22. Based on the information we have gathered and our resulting research, we feel that AEGION CORP has the probability to OUTPERFORM average market performance for the next year. The company exhibits ATTRACTIVE Momentum and Price Sales Ratio.
|
ValuEngine Forecast |
||
|
Target |
Expected |
|
|---|---|---|
|
1-Month |
20.26 | 0.55% |
|
3-Month |
20.76 | 3.03% |
|
6-Month |
21.42 | 6.31% |
|
1-Year |
21.48 | 6.60% |
|
2-Year |
24.54 | 21.81% |
|
3-Year |
25.55 | 26.78% |
|
Valuation & Rankings |
|||
|
Valuation |
15.29% overvalued |
Valuation Rank |
|
|
1-M Forecast Return |
0.55% |
1-M Forecast Return Rank |
|
|
12-M Return |
15.87% |
Momentum Rank |
|
|
Sharpe Ratio |
-0.04 |
Sharpe Ratio Rank |
|
|
5-Y Avg Annual Return |
-1.44% |
5-Y Avg Annual Rtn Rank |
|
|
Volatility |
36.09% |
Volatility Rank |
|
|
Expected EPS Growth |
23.08% |
EPS Growth Rank |
|
|
Market Cap (billions) |
0.75 |
Size Rank |
|
|
Trailing P/E Ratio |
17.22 |
Trailing P/E Rank |
|
|
Forward P/E Ratio |
13.99 |
Forward P/E Ratio Rank |
|
|
PEG Ratio |
0.75 |
PEG Ratio Rank |
|
|
Price/Sales |
0.57 |
Price/Sales Rank |
|
|
Market/Book |
11.56 |
Market/Book Rank |
|
|
Beta |
2.08 |
Beta Rank |
|
|
Alpha |
-0.01 |
Alpha Rank |
|
Market Overview
|
Summary of VE Stock Universe |
|
|
Stocks Undervalued |
53.63% |
|
Stocks Overvalued |
46.37% |
|
Stocks Undervalued by 20% |
22.89% |
|
Stocks Overvalued by 20% |
15.72% |
Sector Overview
|
Sector |
Change |
MTD |
YTD |
Valuation |
Last 12-MReturn |
P/E Ratio |
|
Basic Materials |
-0.09% |
6.46% |
46.52% |
14.28% overvalued |
51.99% |
31.03 |
|
Consumer Staples |
0.26% |
2.67% |
10.19% |
8.80% overvalued |
8.31% |
24.49 |
|
Utilities |
0.78% |
3.08% |
14.21% |
7.78% overvalued |
10.77% |
23.66 |
|
Multi-Sector Conglomerates |
-0.06% |
1.92% |
5.98% |
4.98% overvalued |
-8.84% |
18.70 |
|
Industrial Products |
0.33% |
4.96% |
10.56% |
1.68% overvalued |
1.71% |
22.67 |
|
Business Services |
0.53% |
4.30% |
15.21% |
1.22% overvalued |
-3.96% |
23.80 |
|
Aerospace |
0.47% |
2.75% |
-2.42% |
0.72% overvalued |
-3.95% |
19.16 |
|
Construction |
0.48% |
6.67% |
28.05% |
0.04% undervalued |
3.73% |
22.30 |
|
Finance |
0.46% |
3.70% |
5.01% |
1.34% undervalued |
-1.41% |
16.46 |
|
Computer and Technology |
0.43% |
4.20% |
9.91% |
1.38% undervalued |
-1.15% |
29.60 |
|
Consumer Discretionary |
0.29% |
4.64% |
7.20% |
2.40% undervalued |
-5.84% |
21.98 |
|
Oils-Energy |
-0.07% |
0.82% |
17.34% |
2.45% undervalued |
-16.84% |
23.84 |
|
Transportation |
0.70% |
7.10% |
8.32% |
7.73% undervalued |
-23.11% |
14.19 |
|
Retail-Wholesale |
0.16% |
3.29% |
-0.13% |
8.15% undervalued |
-8.43% |
22.39 |
|
Medical |
0.17% |
5.44% |
0.36% |
9.43% undervalued |
-22.50% |
28.32 |
|
Auto-Tires-Trucks |
0.51% |
5.64% |
2.98% |
15.85% undervalued |
-8.08% |
12.62 |
Valuation Watch: Overvalued stocks now make up 46.37% of our stocks assigned a valuation and 15.72% of those equities are calculated to be overvalued by 20% or more. Seven sectors are calculated to be overvalued.
Disclosure: None.
Disclaimer: ValuEngine.com is an independent research provider, producing buy/hold/sell recommendations, ...
more


