A Bit More Downside Potential In Gold Stocks
Last week we projected 5% to 10% downside in the gold stocks. Well, not to butter my own bread but GDX and GDXJ both lost 9% on the week. That being said, I believed that the weakness would be limited and miners could rebound to new highs in September. While that possibility remains, there is a chance this correction could go a bit deeper and perhaps last longer.
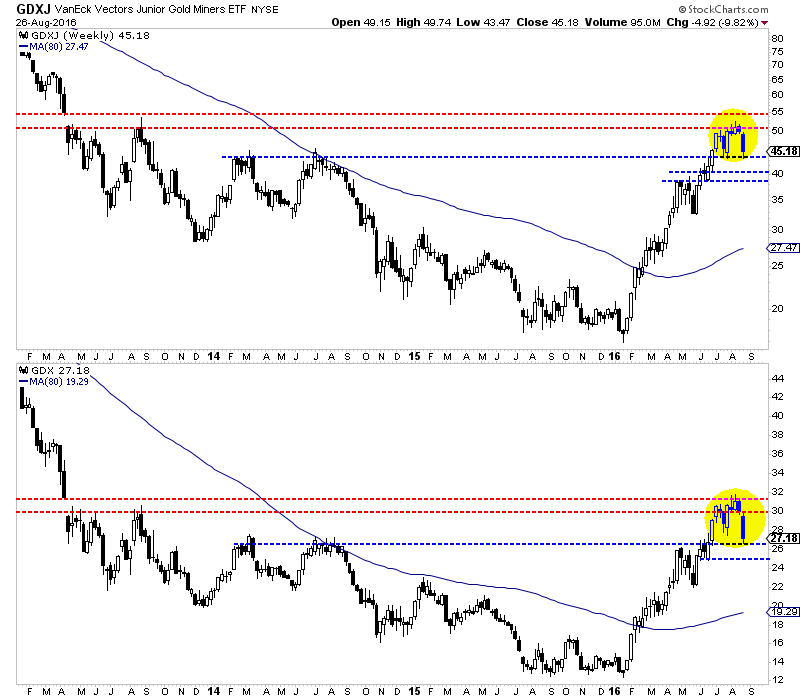
The weekly candle charts below show that the miners are correcting after failing to break into a “thin zone” of resistance. GDX has broken below its July lows and corrected as much as 16%. It has support at $25-$26 and that includes the Brexit gap. Also, the 38% retracement of its entire rebound is just below $25. Meanwhile, GDXJ has yet to break its July low in the $43s. It has corrected as much as 17% but could end up testing $39-$41. The 38% retracement of its entire rebound is a hair below $39.

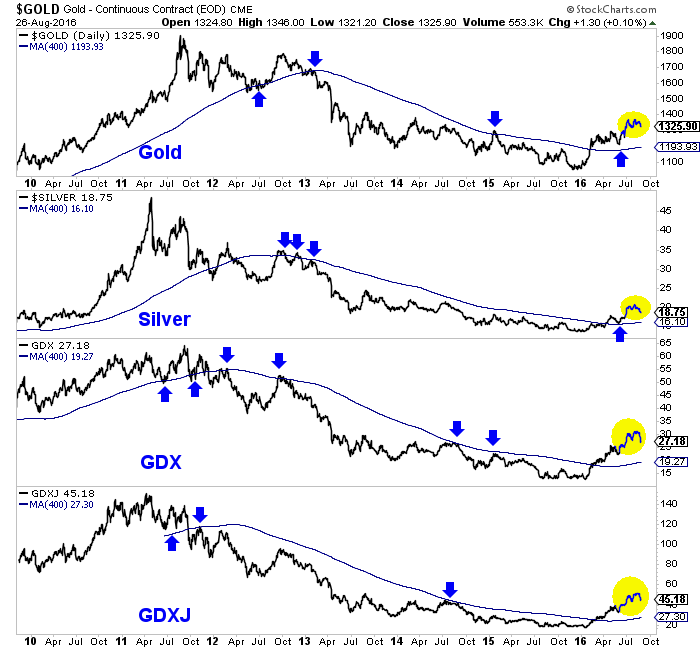
Whether the correction lasts longer or evolves into a long consolidation, precious metals will remain in a bull market. It is hard to argue against the chart below. We plot Gold, Silver, GDX and GDXJ along with the 400-day moving average which is an excellent indicator of the primary trend. The sector sits comfortably above the 400-day moving averages which are sloping upward for the first time in years.

While we expected this correction, we did not anticipate there would be a chance for a larger correction. If you believe we are in a new bull market, as I do, then the path to financial success is buying and holding and buying weakness. (Our guidance for selling, we’ll get to another time). If I were holding too much cash or missed the epic rebound, I would be taking advantage of further weakness. Buying 20% to 25% weakness in a bull market (especially one that is only months old) will likely payoff in the long run.


